

An Optimistic Catastrophe
An Optimistic Catastrophe
When a Price and Earnings Bubble Deflate

This week’s order of business is to be optimistic! This will be something new since this substack was launched at the end of last November, as my analytical process has been quite dour since that inception. With the S&P 500 Index price down about 15% from the end of 2021 through yesterday's close, one could argue that stocks look ‘cheap’!

S&P Global offers access to its historical data on the S&P 500 Index’s price, sales, earnings, etc. The charts in this post generated via Datawrapper were all sourced from their most recent public data through Q4 2021.
There is obviously a range of earnings estimates for 2022 and 2023, with 2021 operating earnings already ‘in the books’ at 208.21 with a closing index price as of December 31, 2021, of 4766.18, for a Price to Earnings ratio of just under 23. That looked towards the high end of the range since Q4 2000 (when they first began publishing sales data for the index), but certainly not ‘crazy high.’ Assuming what many may consider a conservative 5% growth rate in earnings for 2022 and 2023, that would take 2023 operating earnings to about 230. With the index at about 4058 at yesterday’s close, that would be a P/E multiple of about 17.50…. which looks pretty cheap!!!
Yes, this is the level of ‘analysis’ that often comes out of Wall Street. Unfortunately, it is total crap. I mean complete and utter garbage. Here was a log chart over the same period, showing the price of the index along with sales for the index:
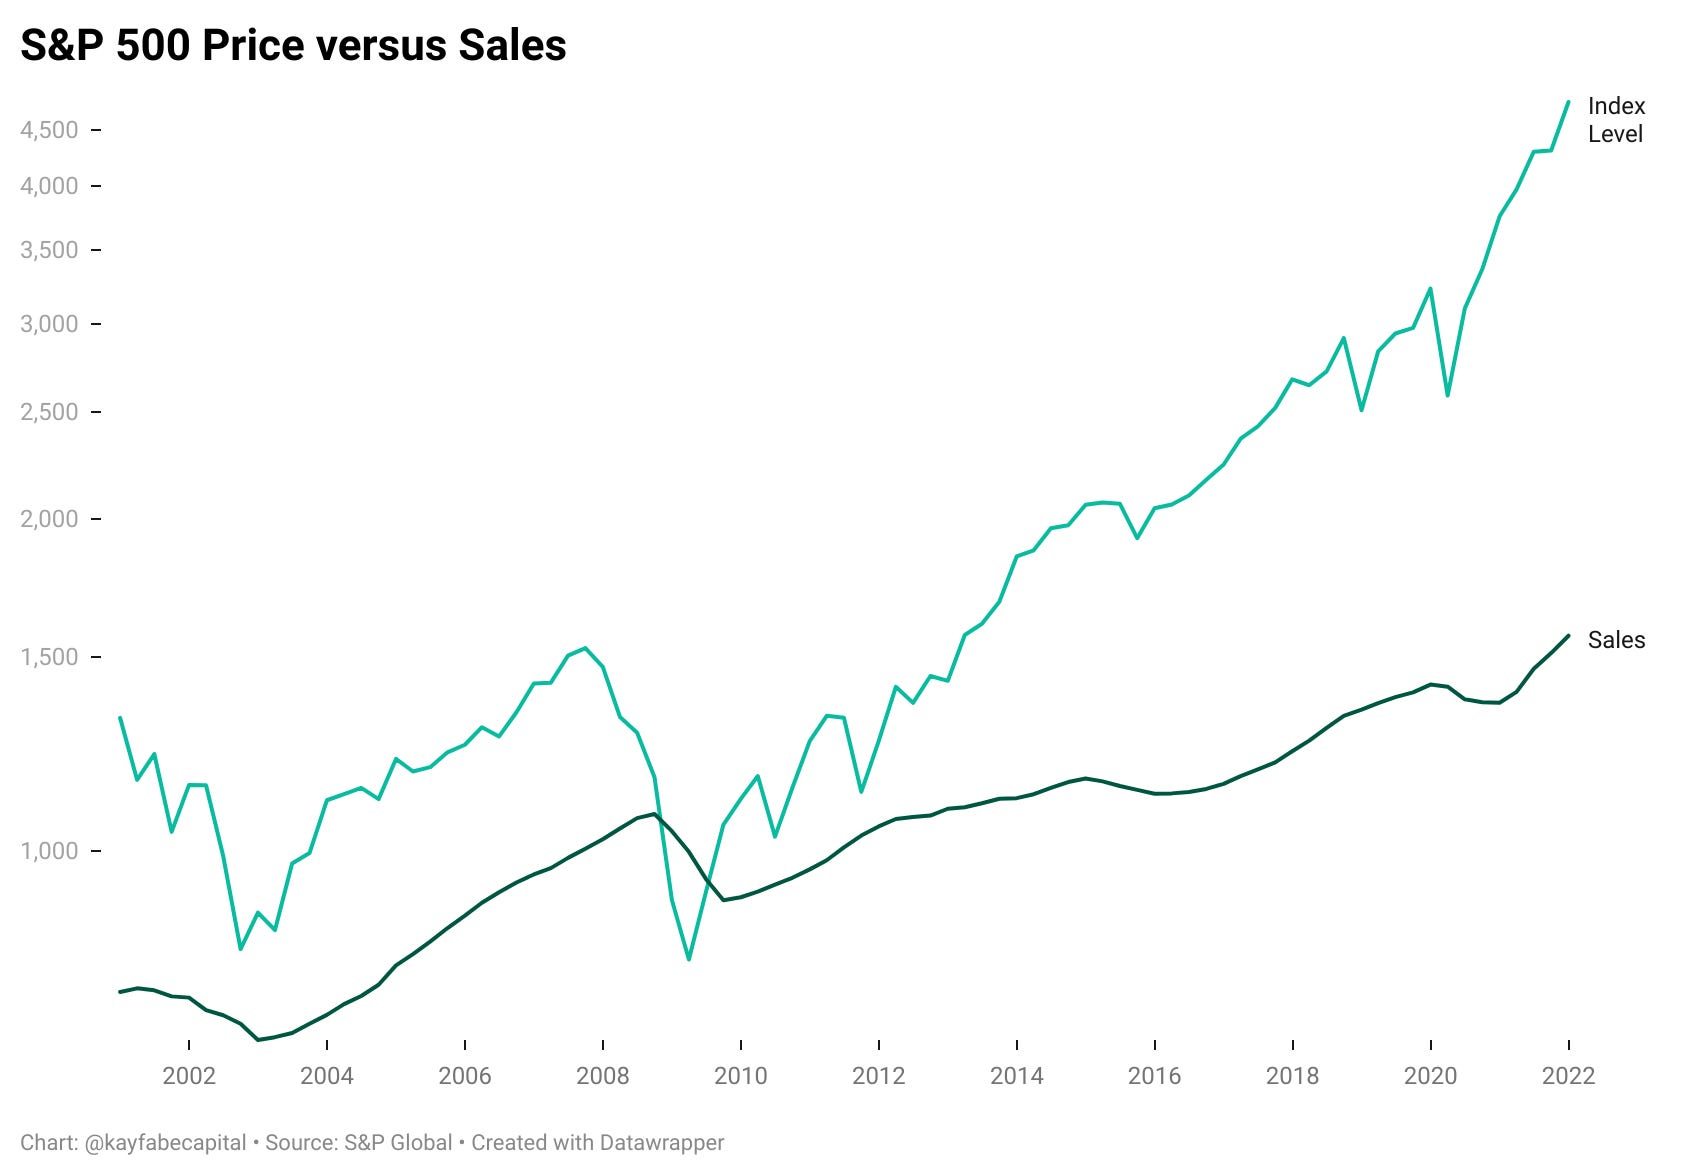
Here was the Price to Sales ratio, which captured the ‘alligator’ jaws that opened up following the Global Financial Crisis:
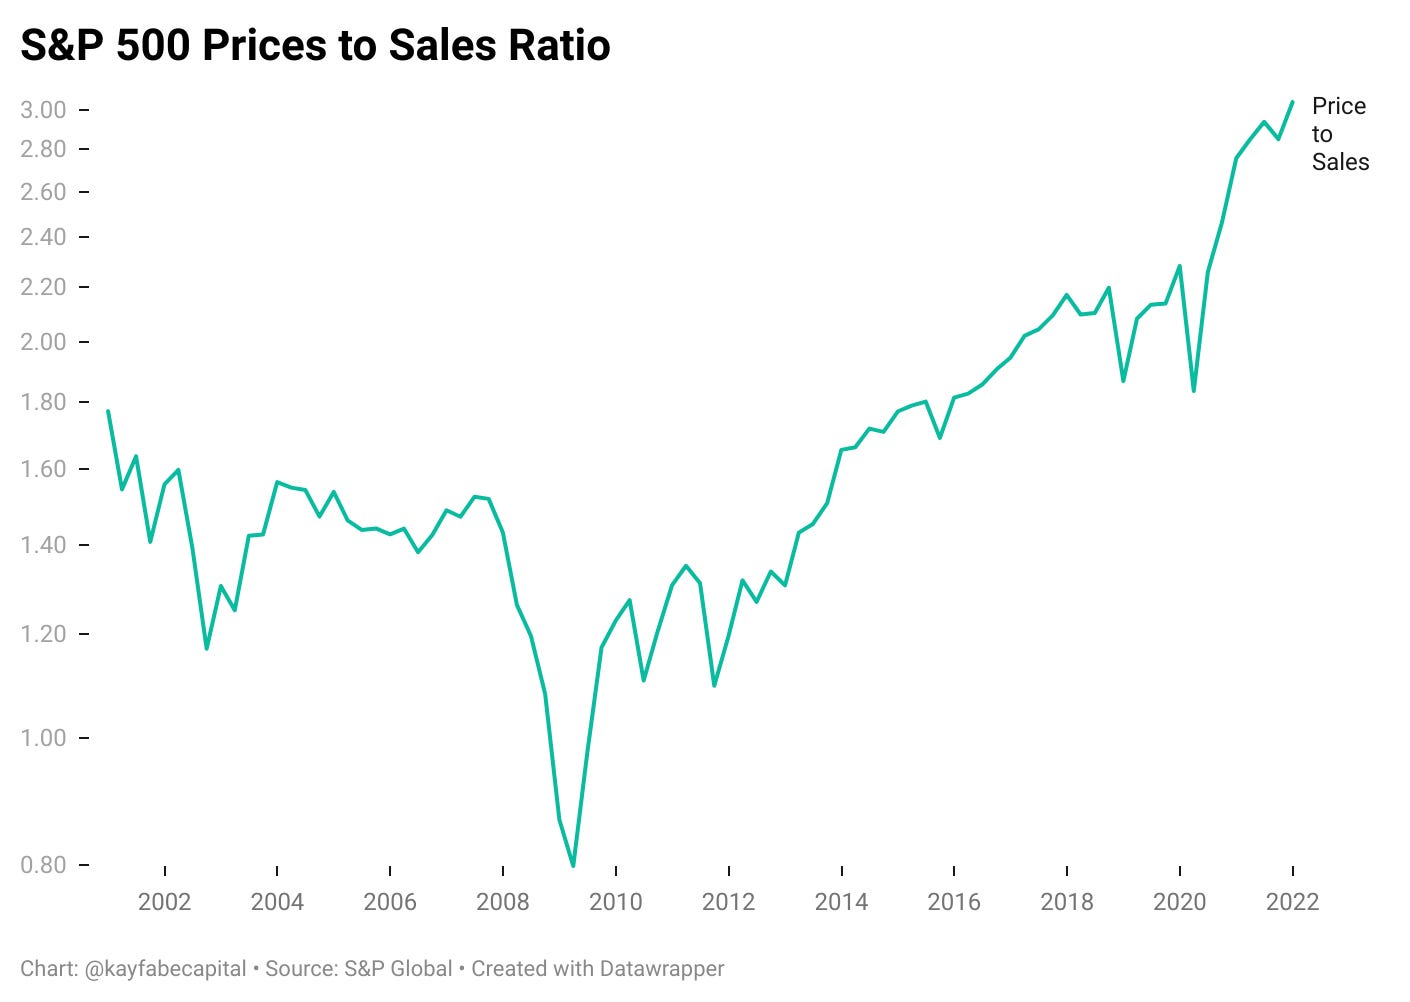
A key factor in the disparity between Price to Earnings and Price to Sales has been profit margins:
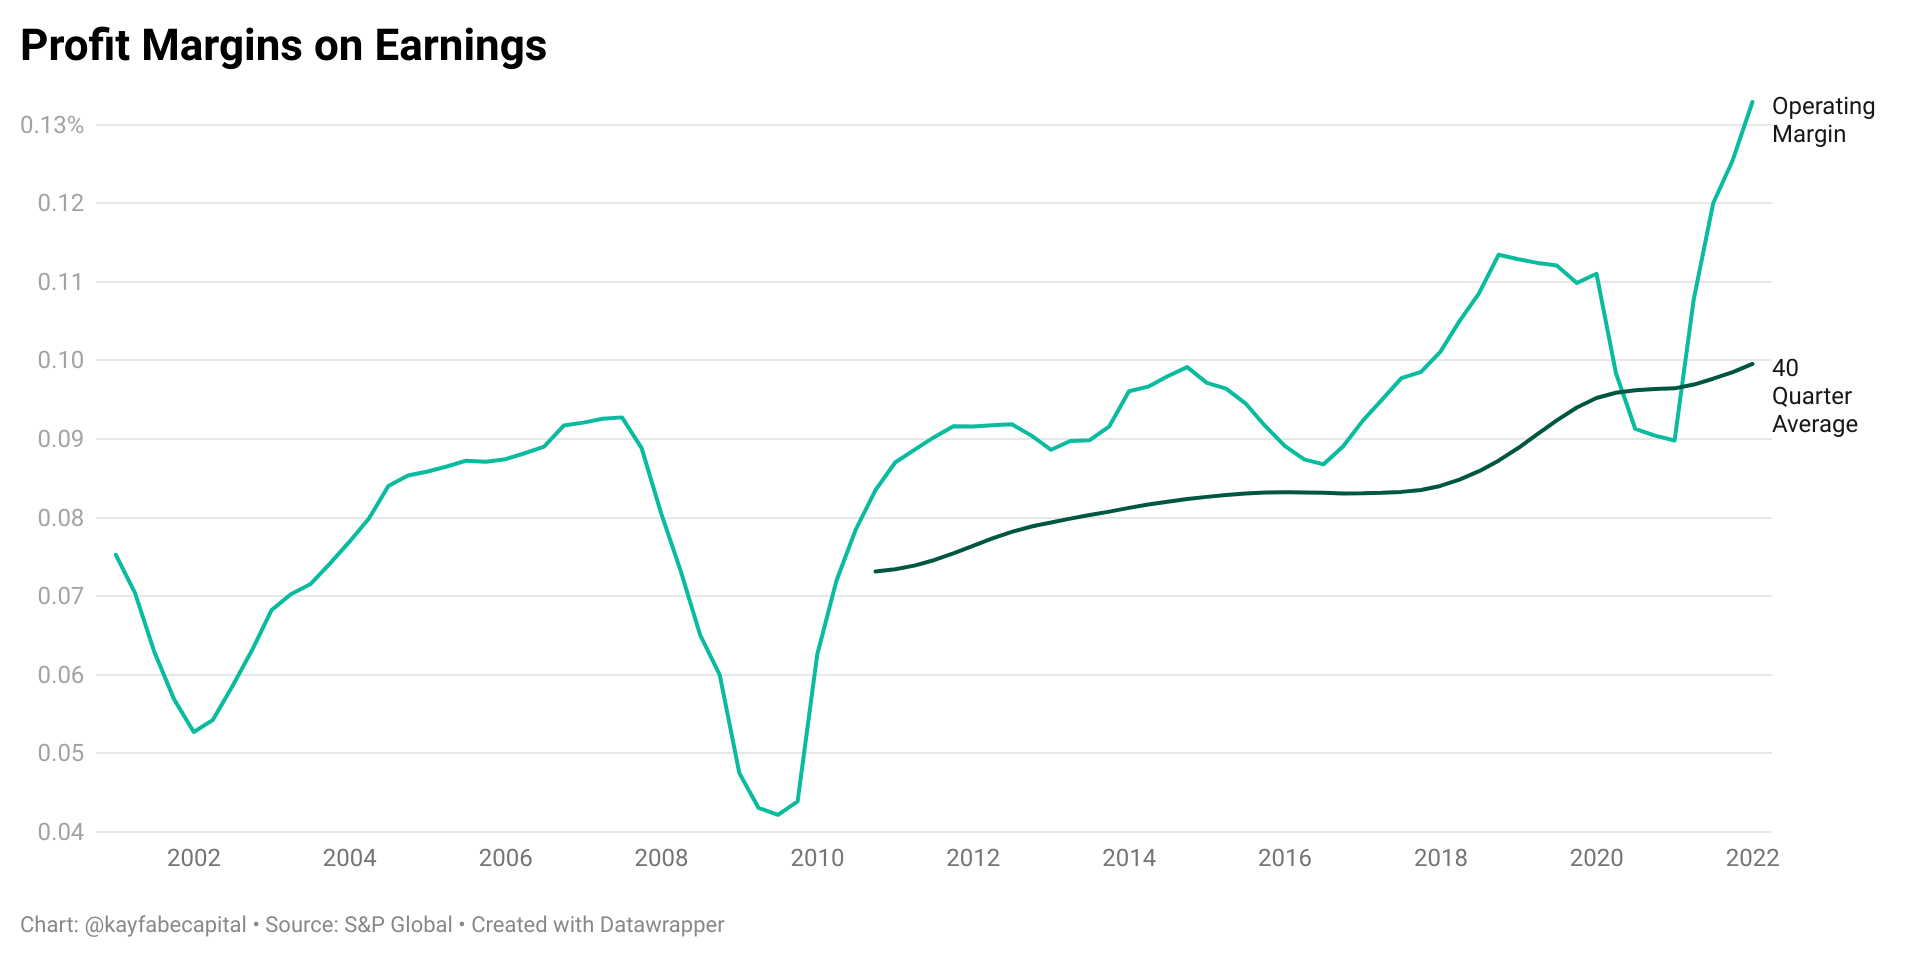
I have added a 40-quarter average line, which offers some insight into the profit margin levels embedded into what many refer to as the Shiller P/E or CAPE, which takes trailing 10-year average earnings to calculate the price-to-earnings multiple. The concept is both simple and reasonable, as one may expect a 10-year period to allow for normal business cycle variability. As one can see, a 10-year lookback embedded about 10% operating profit margins. Historically speaking, prior to the GFC margins had generally oscillated between 6% to 10% outside of recessions.
This was a chart from John Hussman, which I first referenced shortly after he published it back in January:
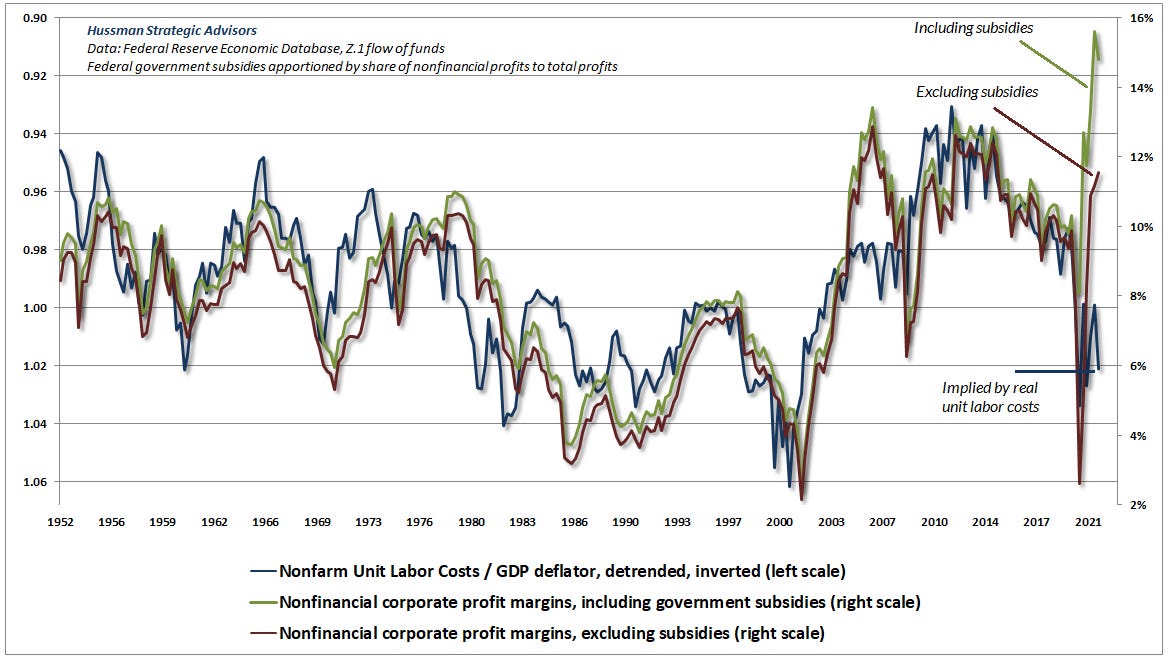
John shared the impact of the massive government stimulus during the pandemic, and how much it had boosted profit margins. Important note- his chart backed out the impact of financial company profits and was broader than just the S&P 500 companies. I shared this to offer some context on the impact of the stimulus- not as an apples to apples comparison with S&P 500 data.
Independent of business cycle risks of a potential recession at some point over the next year, we know a few things for sure relative to margins:
The government stimulus that pumped margins has ended.
Post-GFC margins were boosted by lower interest expenses, relatively stagnant labor costs, and decades of offshoring via globalization.
Global supply chains were optimized for efficiency and profitability.
I believe it is reasonable to suggest that all of these tailwinds have either ended or actually become headwinds. So let us do a little simple arithmetic using some reasonably optimistic assumptions to create a range of scenarios.
Sales will grow over the next five years in alignment with nominal GDP growth of 6% on average per year. That would result in S&P 500 sales of about 2,097 in year five.
Operating profit margins go to 8%, which would be around the midpoint of the historical range and just below the average since the year 2000. That would mean operating earnings after year five of about 168.
What multiple should we place on those earnings? With the secular tailwinds of globalization, lower interest rates, stagnant labor costs, and optimized global supply chains, the average since 2000 have been about 19. Seem reasonable, if not optimistic?
When I said simple arithmetic, I was not kidding: 168 x 19 = 3,192
Ok - how about we get REALLY optimistic rather than ‘reasonably optimistic’? Assuming 10% margins and a 22 multiple would suggest: 210 x 22 = 4,620
Five-year US Treasuries currently yield about 2.72%, which offers some additional perspective on relative risk versus reward, in my opinion.
Of course, this would not be Kayfabe Capital unless we concluded with a less optimistic scenario. Courtesy of Advisor Perspectives, here was ECRI’s WLI year over year growth rate as of last Friday:
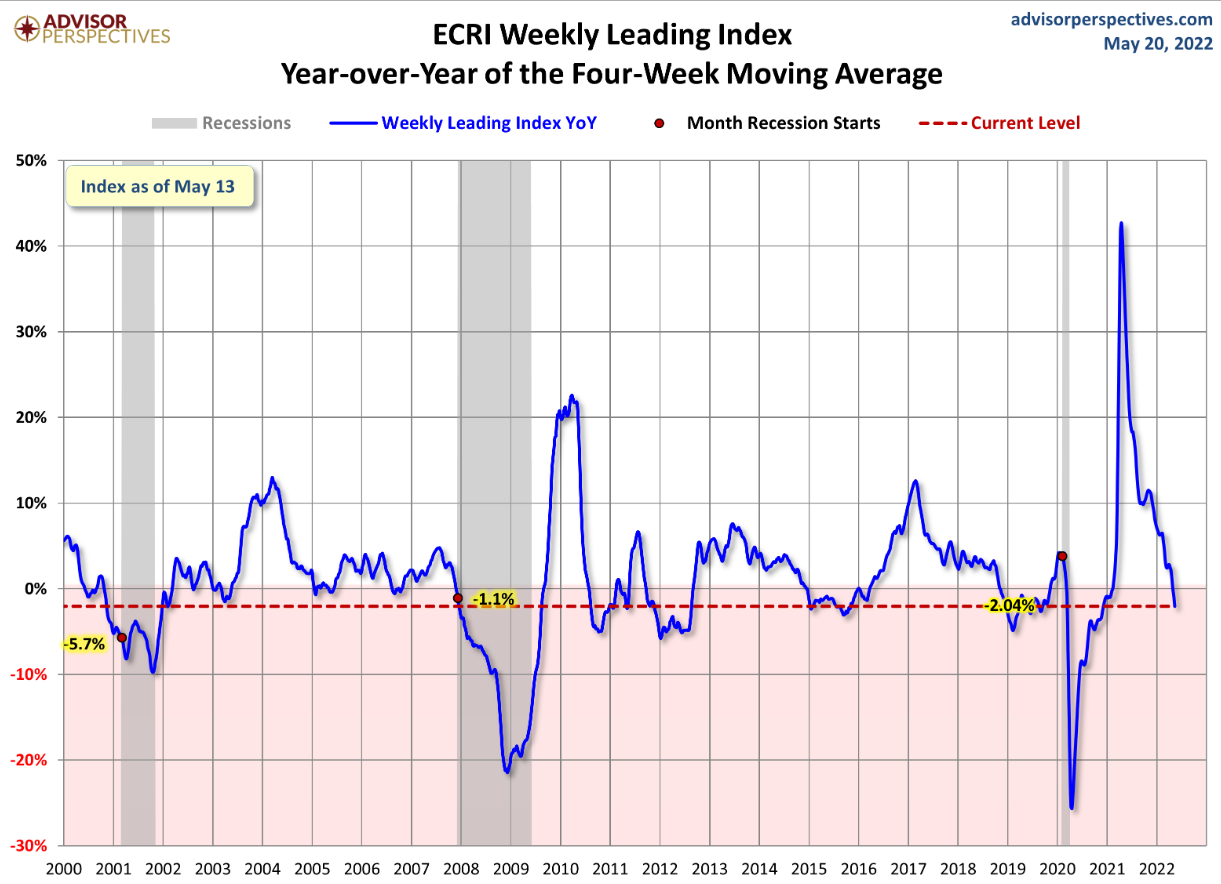
In theory, the decline to below the zero bound could reflect a ‘soft landing’ and the US economy could avoid recession. ECRI just published this op-ed yesterday, which included this opening paragraph (recommend you read the entire op-ed):
The economy is close to entering a recession, perhaps as soon as this year. To avoid taking too much of a financial hit, Americans will need to prepare.
What if there is a recession - seems prudent to prepare as recommended, just in case?
During the 2000-2003 recessionary bear market period, and then again in the 2007-2009 period, operating profit margins went to about 5% and the P/E ratio on those margins went to about 17 (using quarterly data). Even if inflation is sticky and nominal GDP grows at 10% this year (sales actually went down during the 2000-2003 and 2007-2009 periods) and sales growth is the same, then this is the simple arithmetic:
1566.80 in sales x 1.10 = 1723.48 2022 sales
1723.48 in 2022 sales x 5% operating margin = 86.17
86.17 in recessionary operating earnings x 17 multiple = 1464.96 S&P 500 Index price level
Is that crazy? That would be a 70% decline! This is not my forecast - I have no idea. Global central banks and fiscal responses could be massive if/when things begin to head in that direction, but with inflation already a huge problem, timing and scope may be highly uncertain.
But markets often have ‘memories’ over decades of time. For example, the 1929 peak in the S&P 500 price index (retrospectively created) was broken to the downside in inflation-adjusted terms at the 1974 and 1982 bear market lows. Even the 2009 nadir did not approach such depths of despair. However, that 1464.96 calculation does eerily lineup with what would be a ‘test’ of the 13-year consolidation of the 2000 and 2007 peaks:

In the spirit of being optimistically catastrophic, inflating that peak from the breakout year of 2013 by 5% a year (forget about the phoney baloney CPI) would produce about 2300.
The horror of thinking price could return back to where it was all the way back in…..spring 2020. Sounds optimistically catastrophic?
great post!
Corporate tax rates were reduced in 2018 from 35% to 21%. It does not affect operating earnings, but net earnings increase. Any thoughts on the s&p500 price calculations based on net earnings? And top firms will keep innovating and keep improving productivity to try to protect margins.