

Is the Stock Market Crashing?
Is the Stock Market Crashing?
Notice I did not say 'Will the Stock Market Crash'

This week’s post will again be relatively short and sweet. First, go back and read/re-read my December 22nd post, Where are We in Delusion?
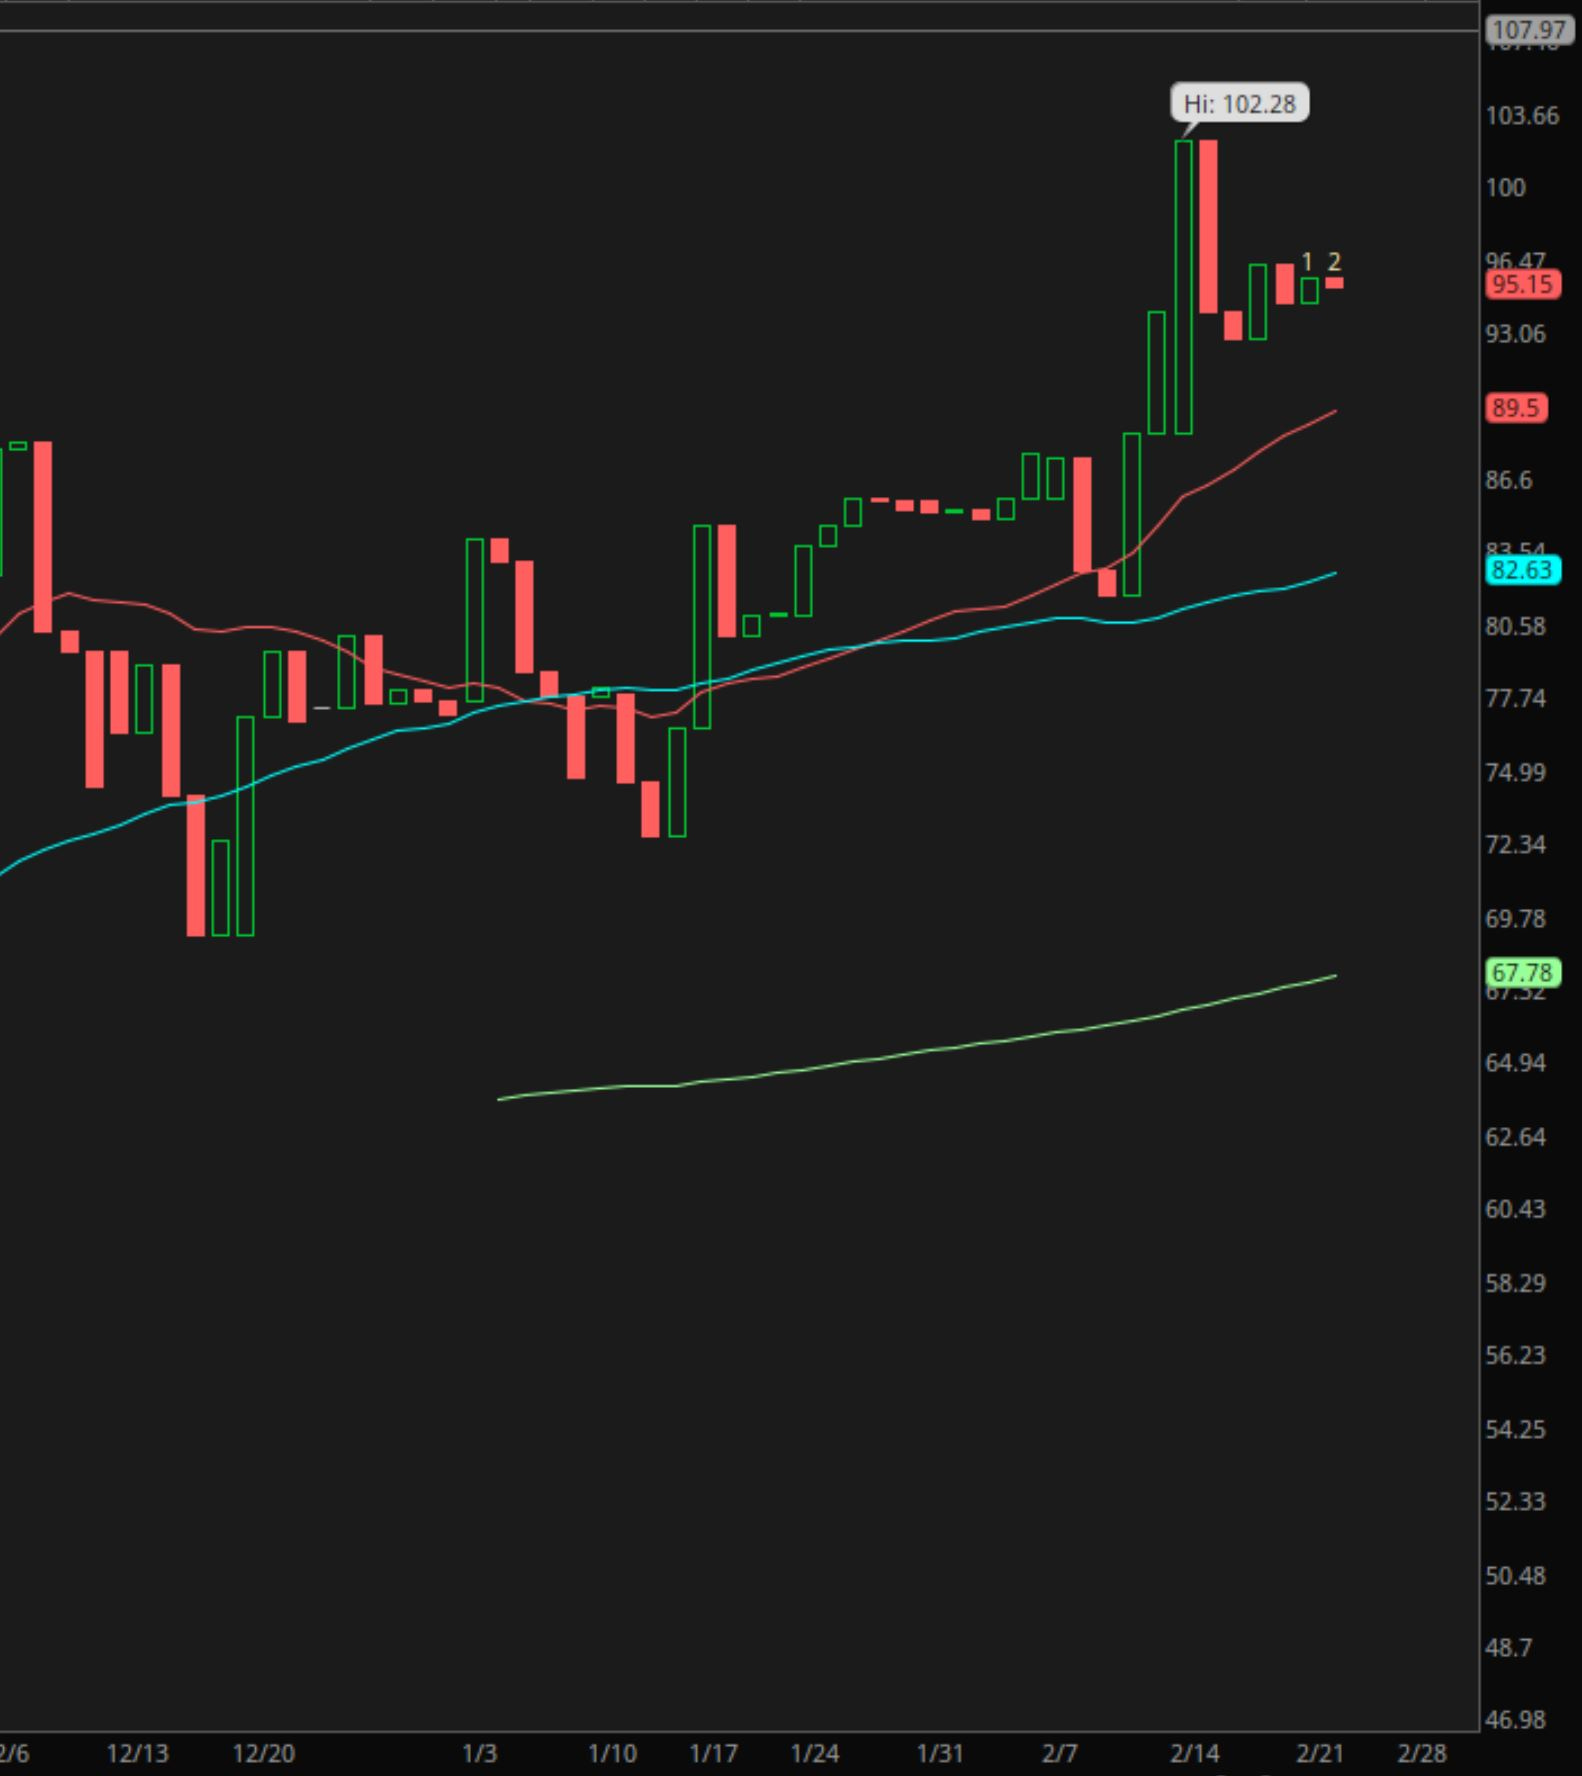
In that post, I laid out how global markets had already begun a scale-invariant ‘earthquake.’ Subsequently, the shaking has spread out from the epicenter, enveloping more and more markets. Here is the MOVE index daily chart since mid-December - it is a gauge of bond market volatility:
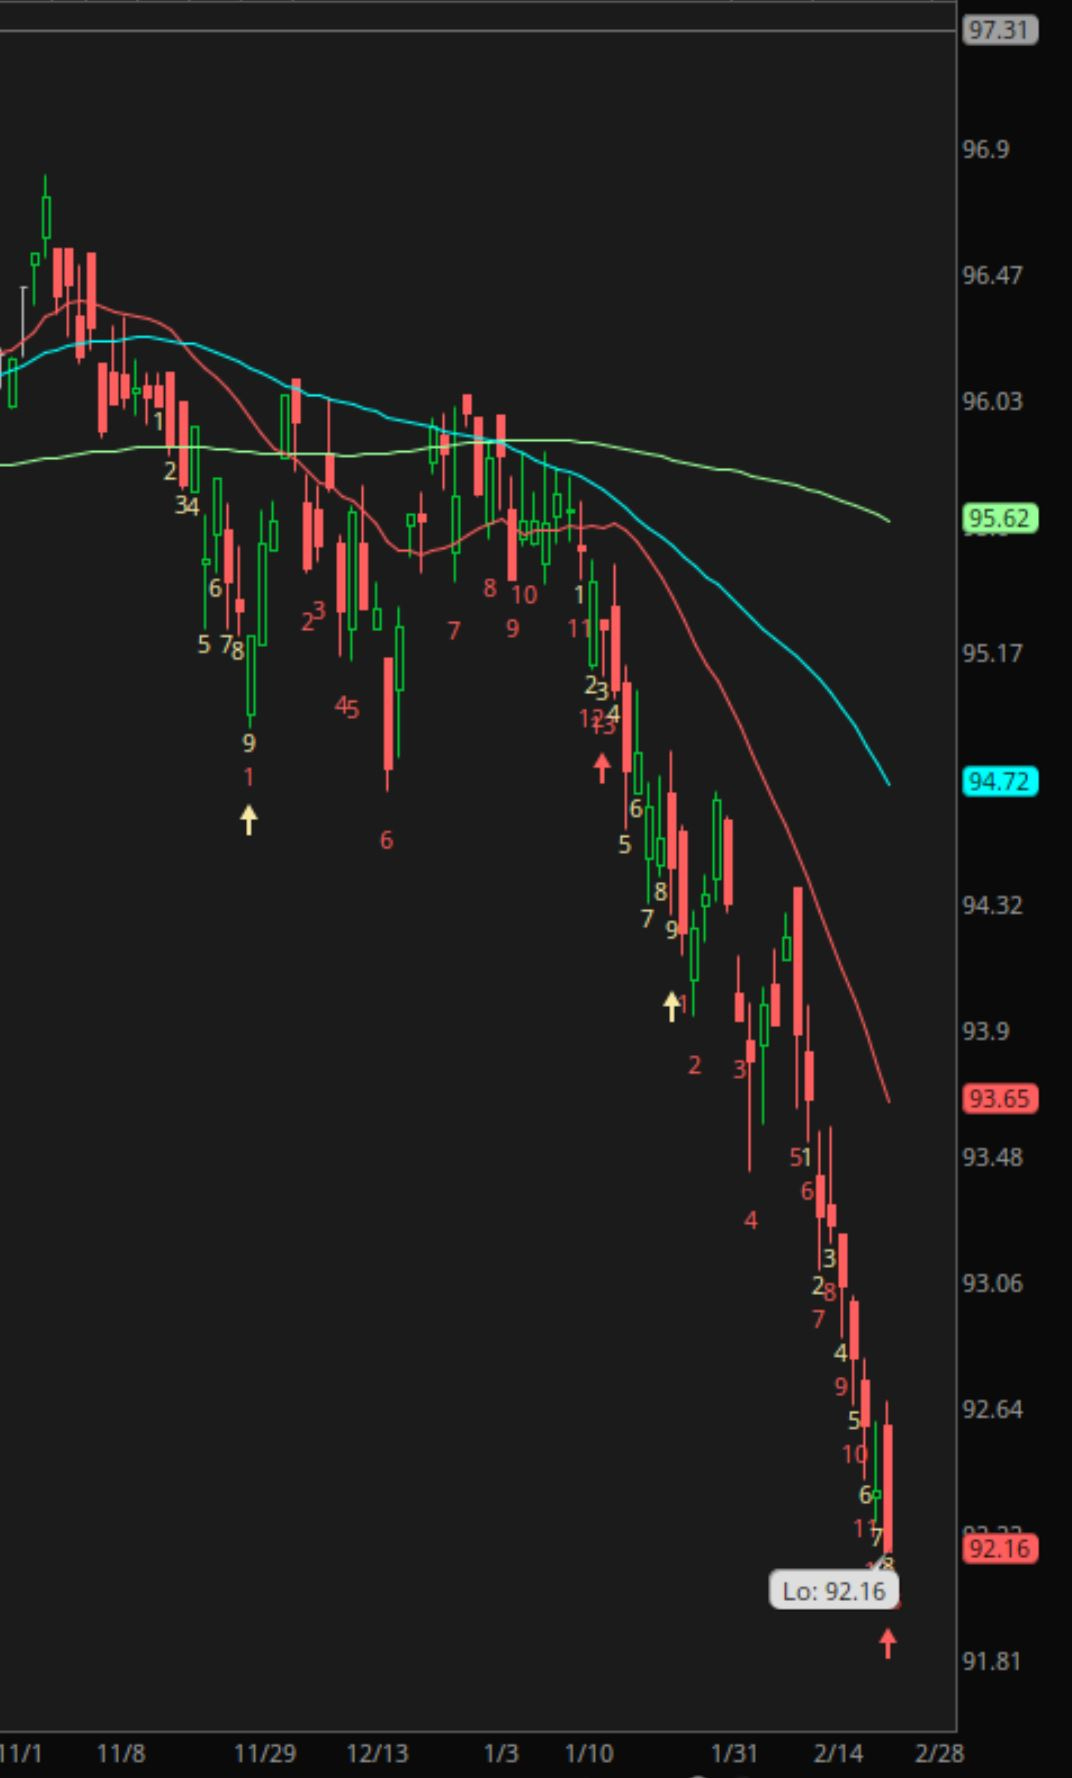
This is a daily chart of LQDH, which is an ETF for investment-grade US corporate bonds, with interest rate risk hedged out. It is a decent proxy for credit spreads - i.e. corporate interest rates relative to US Treasury rates.
What does ‘scale-invariant’ mean and/or look like? Here was the German DAX chart I shared in that December 22nd post:

At that point, it had displayed self-similar scaling in that 30 days 1-hour chart. Here is a 1-year daily chart as of today:
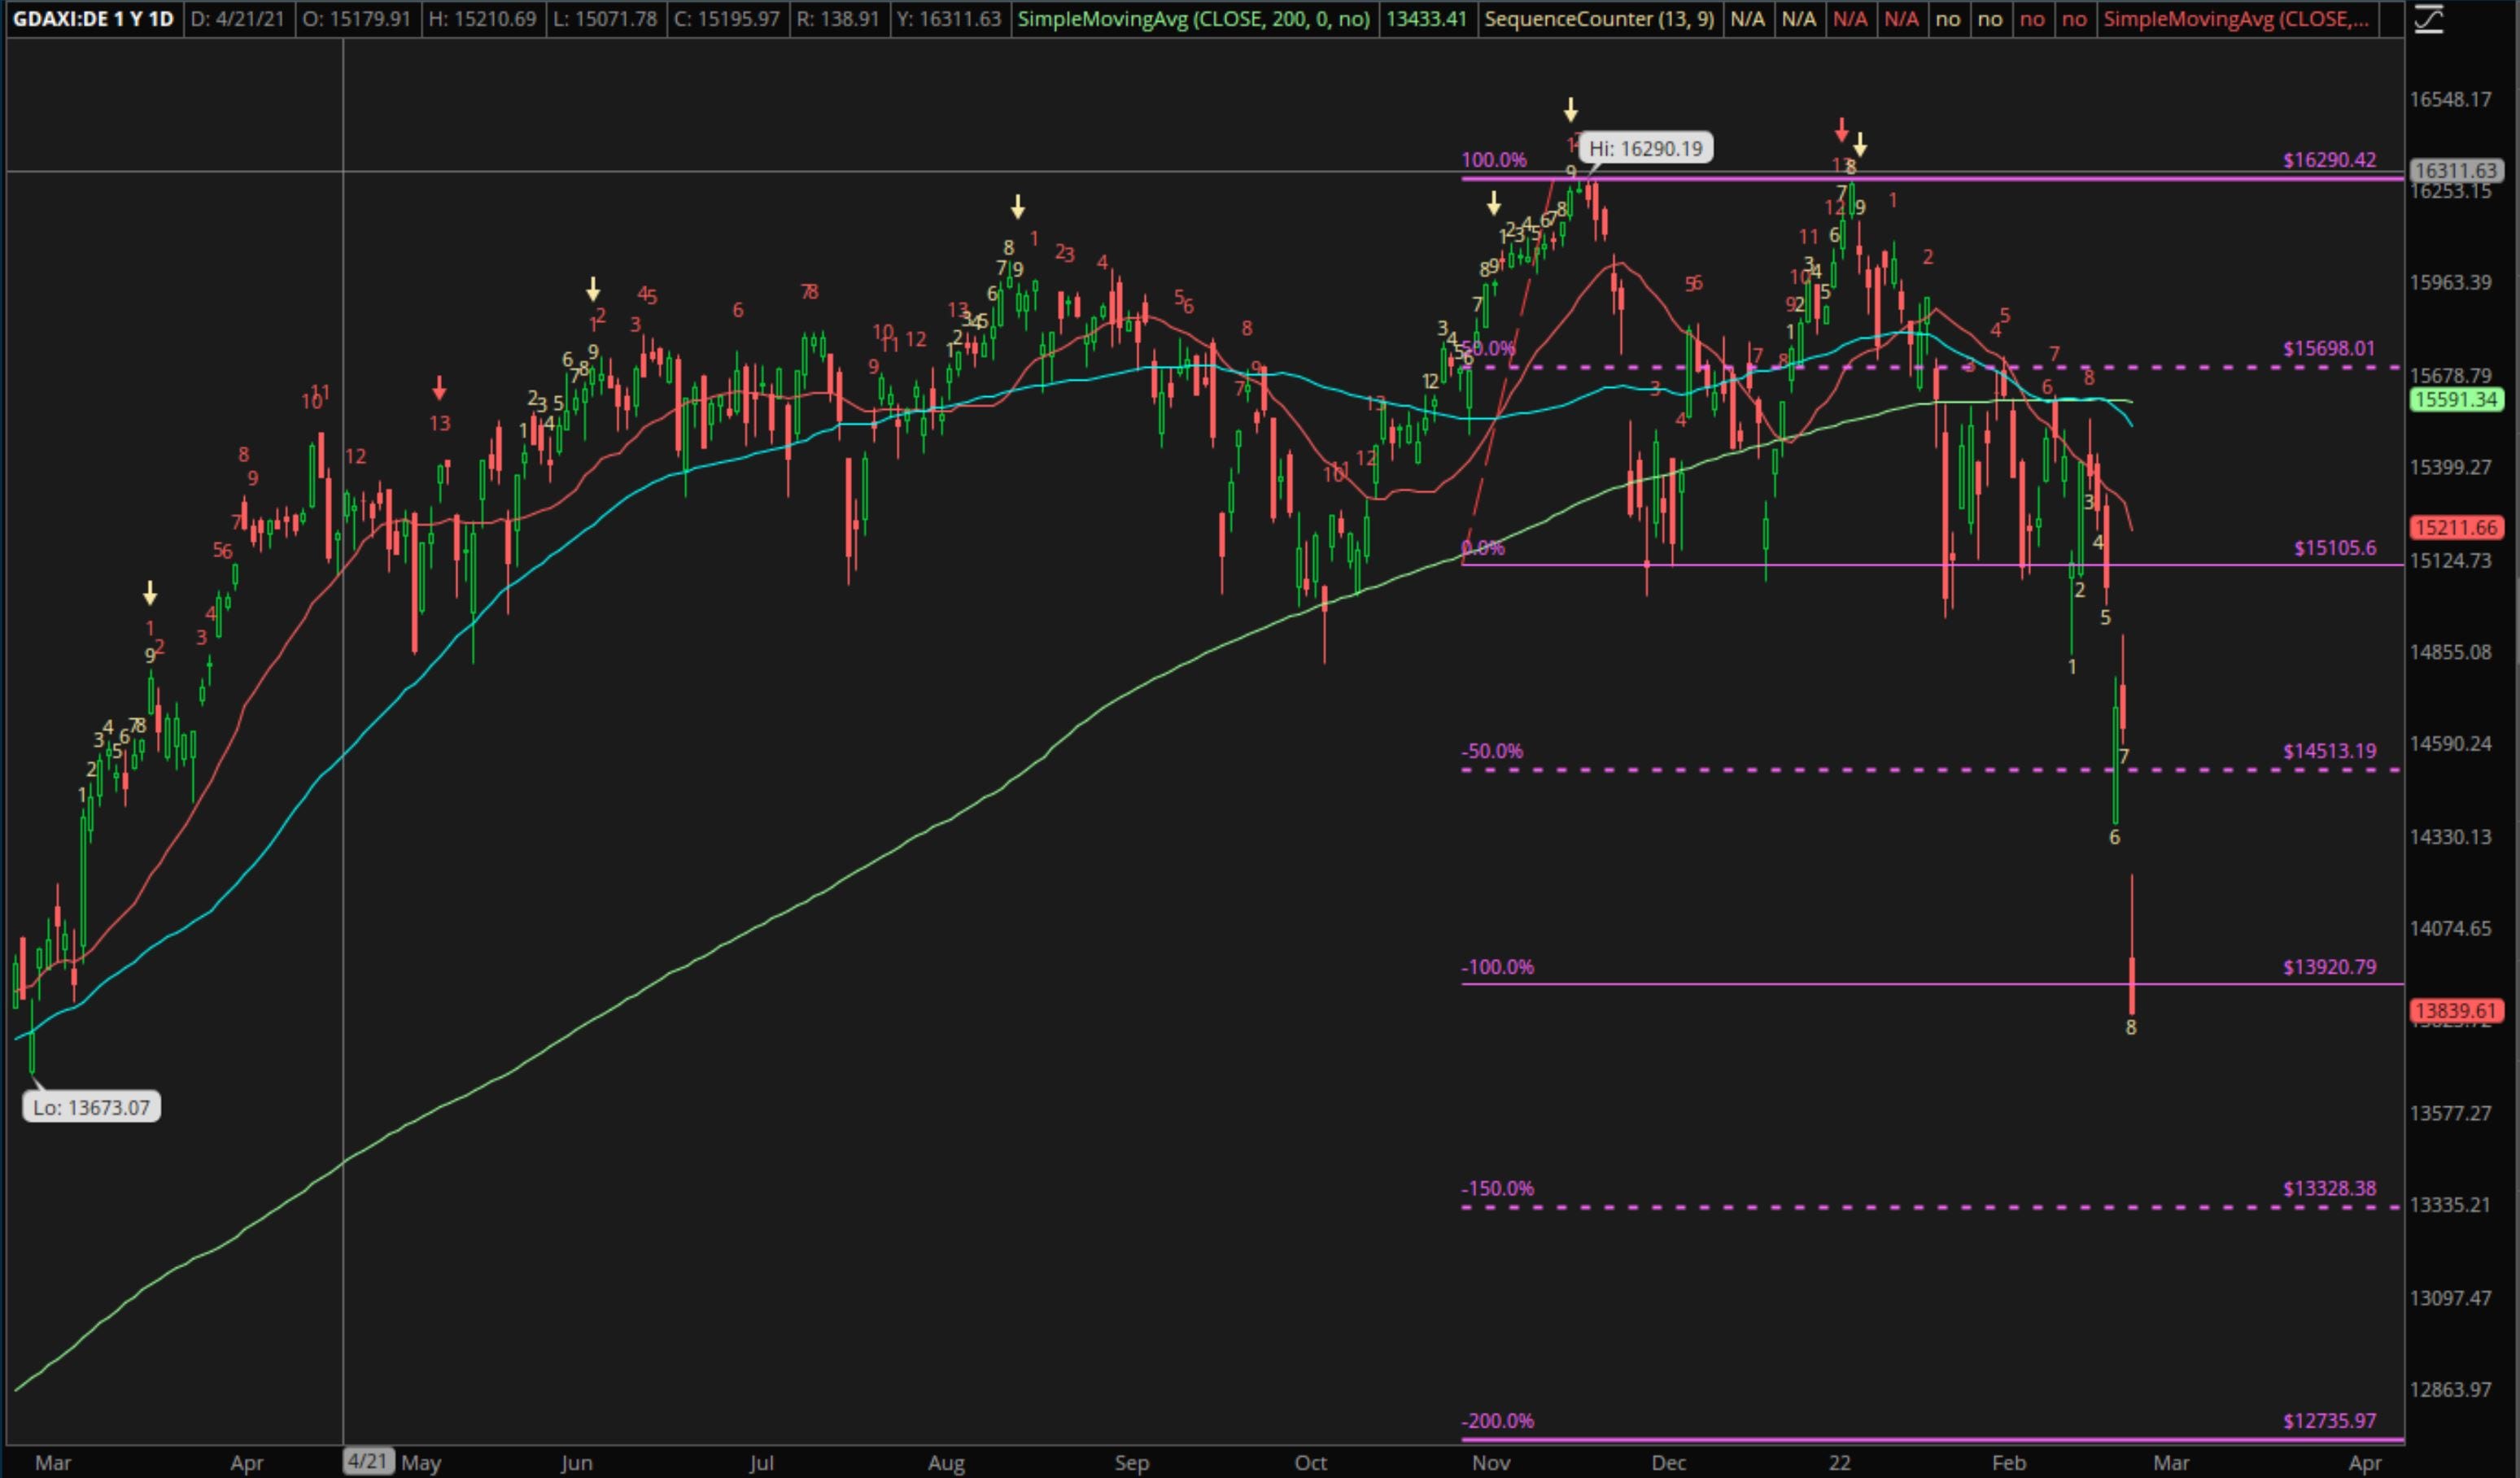
The horizontal lines share the ‘self-similar’ structure, or price DNA, which was in the hourly chart from December 22nd. Like waves in an earthquake, or DNA in human cells, price has been scaling in a scale-invariant fashion.
As I argued in multiple December posts, the hypercritical state of the complex system is paramount - ‘initial conditions’ as an economist may say. The catalysts are always obvious in hindsight - the Plaza Accord in 1987, Enron/Worldcom/Tyco and 9-11-2001, Bear Stearns/Fannie/Freddie/Lehman in 2008, etc. What will it be this cycle? Ukraine has obviously jumped to the head of the ‘class.’
But back to whether the market is crashing - I have no idea. However, initial conditions existed which create the inherent dynamics for a crash, IMO, and price has been displaying scale-invariant/power-law dynamics which suggest an ‘earthquake’ started months ago. I shared this graphic on Twitter last autumn:

No idea whether this will be a 5.0 or 9.0 on the ‘Richter Scale,’ but investors, in aggregate, are incredibly poorly positioned for even a 3.0, which may increase the risks of a far larger dislocation than most likely expect.