

Out of Energy?
Out of Energy?
I am ready for a Friday afternoon nap

The energy oasis within equity markets finally succumbed abruptly to broad market weakness after peaking on June 8th. From that peak through the low yesterday, the energy sector of the S&P 500 index declined about 25% over the subsequent two weeks. The sharp decline resulted in a touch of its 200-day moving average Thursday, so at least a retracement of the recent decline would not surprise. However, is a potential intermediate or longer-term consolidation of the explosive gains of the last eighteen months likely?
The 2008 Global Financial Crisis is an obvious and understandable reference period for many when the topic of recessions and/or bear markets arises. Is it a good one?
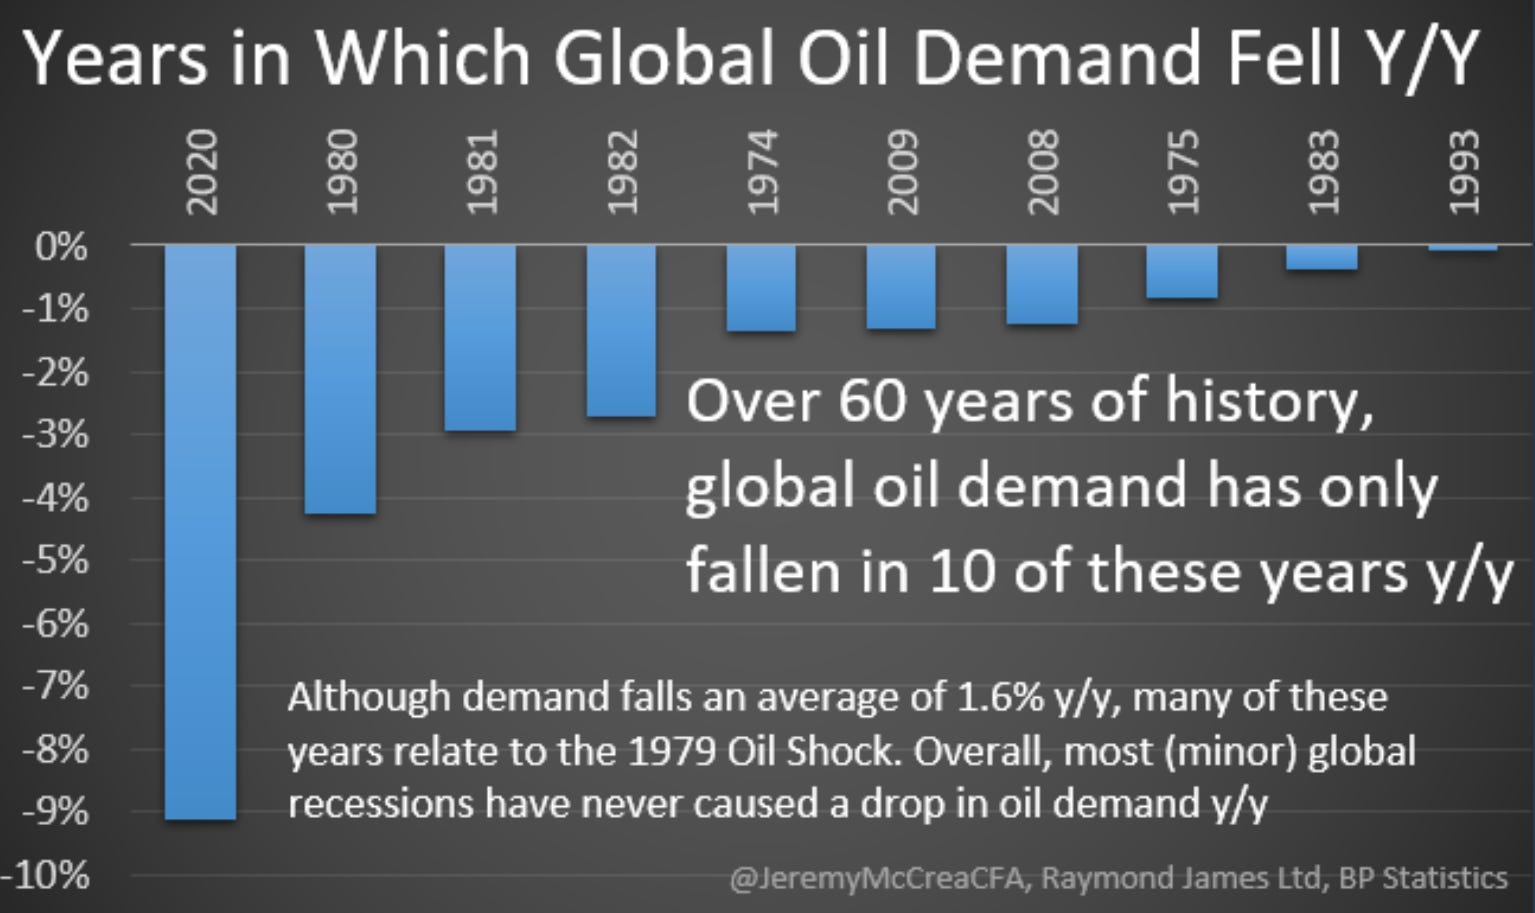
The chart is courtesy of Jeremy McCrea and shows the years over the past few decades in which year over year demand for oil fell globally. Notice they cluster around the worst post-WWII recessionary periods, with the shutdowns in 2020 standing out. However, the 2008-2009 recession was not nearly the worst period for demand falling. How come?

China emerged onto the global stage as an economic power over the past twenty years, and while its growth rate slowed during the Global Financial Crisis downturn, massive government stimulus helped the growth rate to remain relatively high.
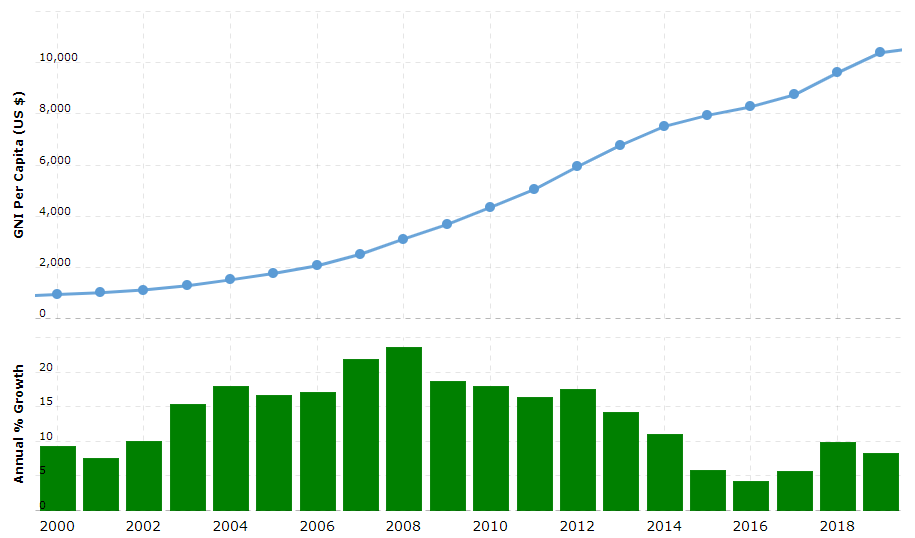
As we can see here, Gross National Income per Capita actually accelerated in 2008 in China. How about the US?
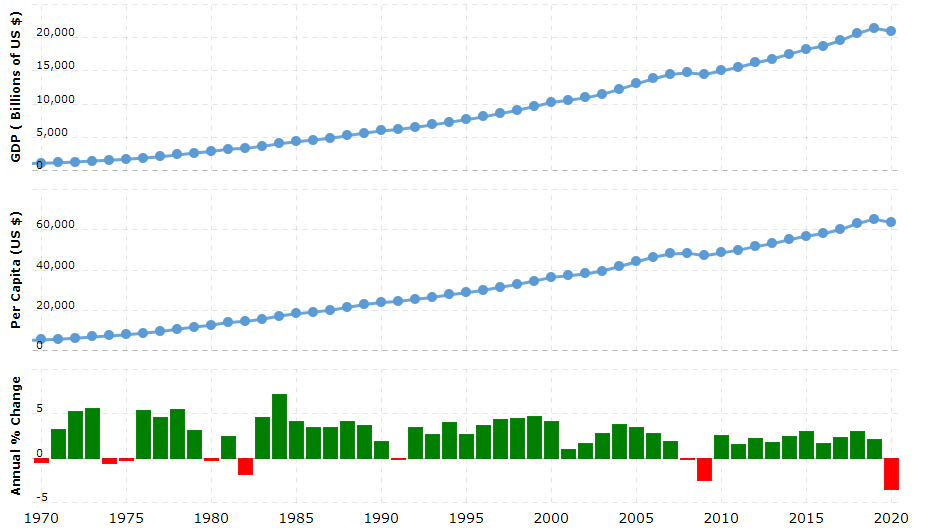
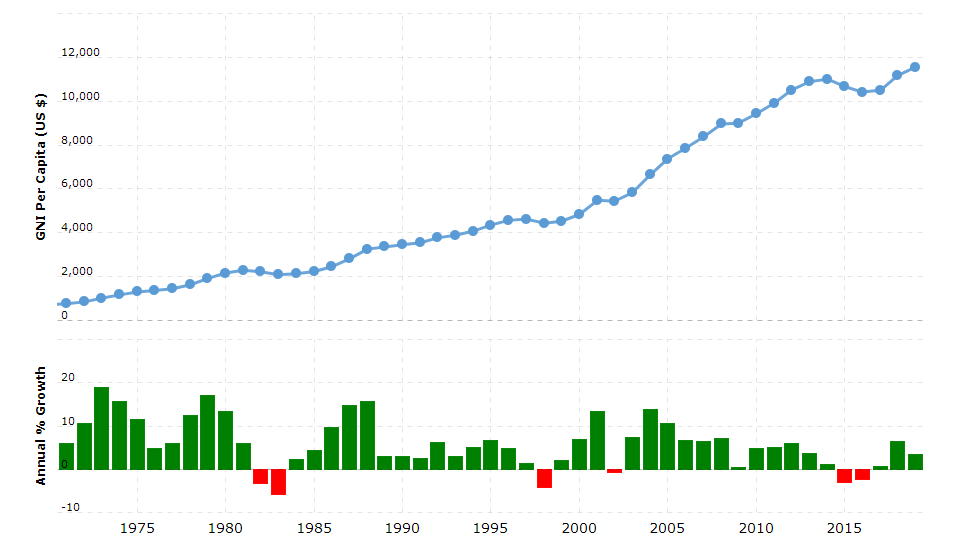
We can see from the first chart when the associated recessionary periods occurred, and I have added GNI per Capital as well. We can see that the Global Financial Crisis period saw a decline in GNI per Capita, but still positive. Conversely, the early 80’s downturn saw a 5 year period of decline in growth rate which went negative for two years:
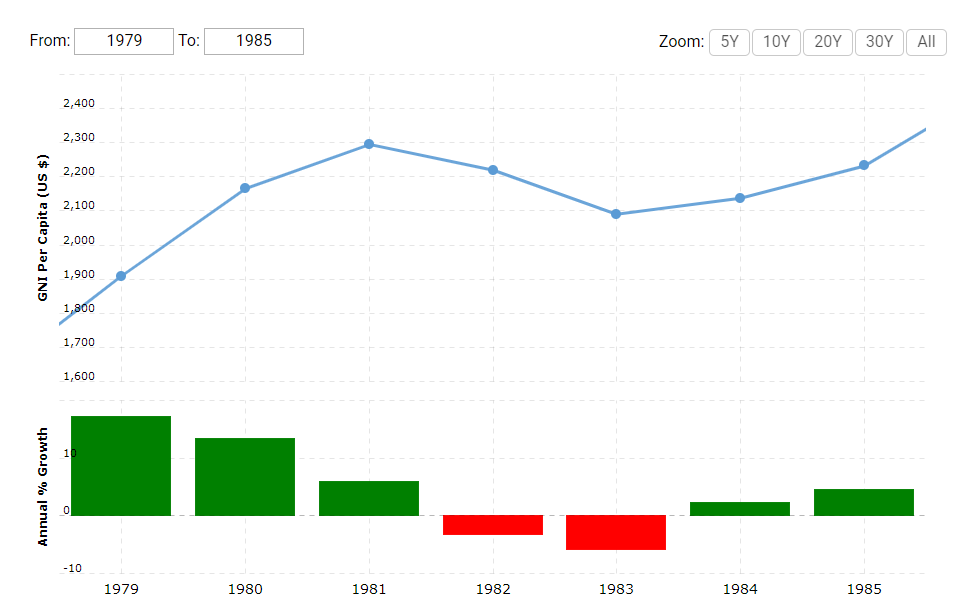
We also saw successive years of decline in this metric in 2015 and 2016. Why would any of this matter?
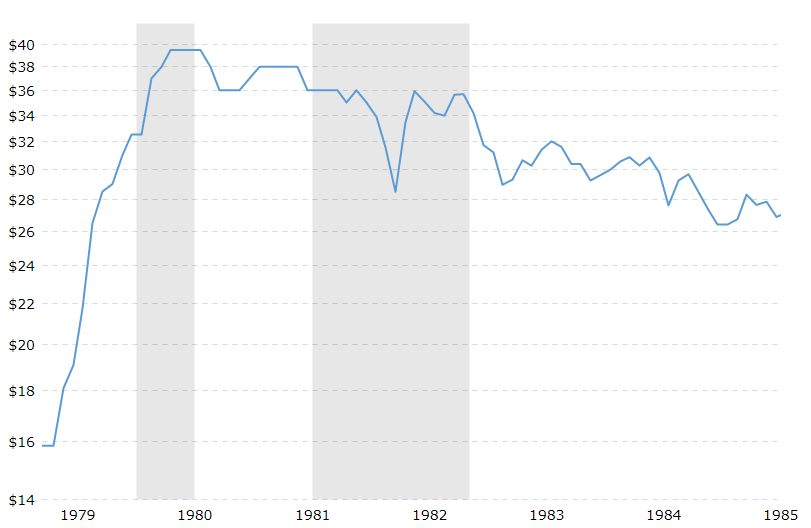
The potential for a synchronized global recession is not abstract, as Lakshman Achuthan from ECRI recently discussed on Yahoo Finance. The last time we saw one was the early 1980’s, which if you notice from the first graphic back at the top, included three successive years of decline in oil demand, with about 10% total.
Here is WTI crude oil over that period, where we see the huge move higher following the Iran hostage situation beginning, and the price increasing through the first of the double-dip recessions in the US. Per the graphic from above, that was amidst the sharpest decline in year over year demand in 1980. Higher prices despite demand destruction….then lower prices.
"According to the EIA, gasoline demand over the last 4 weeks is about 2.0% less than this time last year. As prices continue to rise, I expect that the demand will continue to fall off compared to 2021," Andy Lipow of Lipow Oil Associates told Yahoo Finance.
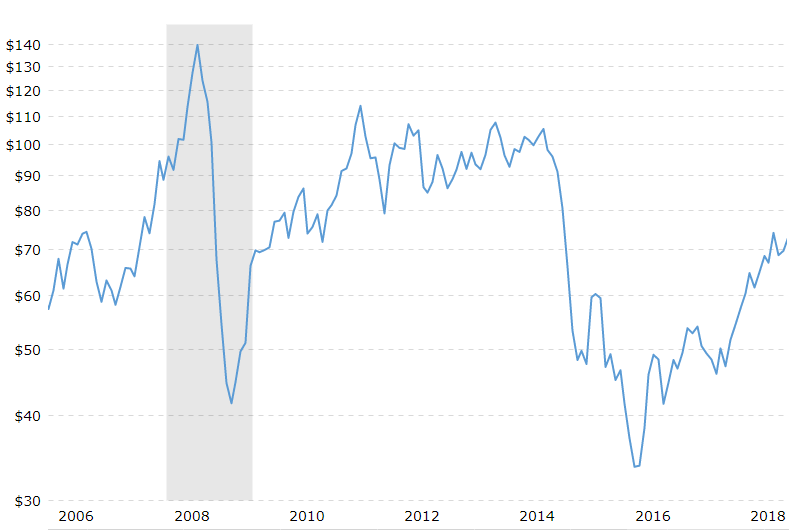
Demand destruction may have already begun as oil and finished product prices spiked sharply over the past 18 months. Even during the global slowdown in 2015-2016, which did not culminate in a global recession, crude oil went from over $100 to under $35:
Yes, the fundamental backdrop may be significantly different this cycle relative to supply constraints, whether they be ESG-related, sanctions, etc. However, the potential for a global recession where incomes per capita decline could result in a decline in demand which may test the nerves of long-term energy bulls.
Throw in the potential for poor political leadership making things worse and risk that the massive passive market bid and related flows reverse at some stage during this bear market, and energy equities may be facing significant headwinds in the coming weeks. Think scenarios like the US banning exports, Brent goes to $200 while WTI to $80, with western governments passing industry-specific taxes, is crazy? Have you been paying attention to how many crazy decisions policymakers have already been making?
Given the severity of the recent decline, a sharp rebound and retracement would be pretty typical even if a more protracted decline is to transpire. It may be a good time to consider right-sizing long-term exposure in order to use potential downside to one’s advantage.
I am curious about your opinion how does today’s rising food prices - grain fertilizer, stock market, unemployment to come, and now oil combined - are different from the 1980s / is the demand destruction greater is the impact on oil will be more significant?
Thank you for this article. What if the problem is supply side? Not only do we have OPEC+ delivering less and and less oil, Russia may see supply destruction, Libya will probably be offline entirely for a period, Ecuador is a risk... refineries running near 100% in West. China could bring refined product supplies online, not sure if they will choose to or not. India may balk at the idea of a "price cap" implemented by G7 countries... or perhaps they will benefit from a price cap and export more? As much as there are headwinds for demand, there are at least as many risks to supply, perhaps more? Is that part of your analysis? Tx