

Sayonara Swiss?

One of the aspects of being a more macro-focused market participant is spending most of my time looking across broad market relationships. Rather than digging into individual company fundamentals or even charting them, it involves things like monitoring and considering foreign currency cross rates: like the Swiss Franc vs Japanese Yen in this daily chart, for example:

An interesting development during this year’s decline in risk assets has been the change in behavior in the Swiss Franc and Japanese Yen relative to the past couple of decades. For quite some time now, the former had been viewed as a ‘flight to quality’ destination during de-leveraging/de-risking episodes, while the Yen a carry trade funding currency that similarly received flows as those trades unwound.
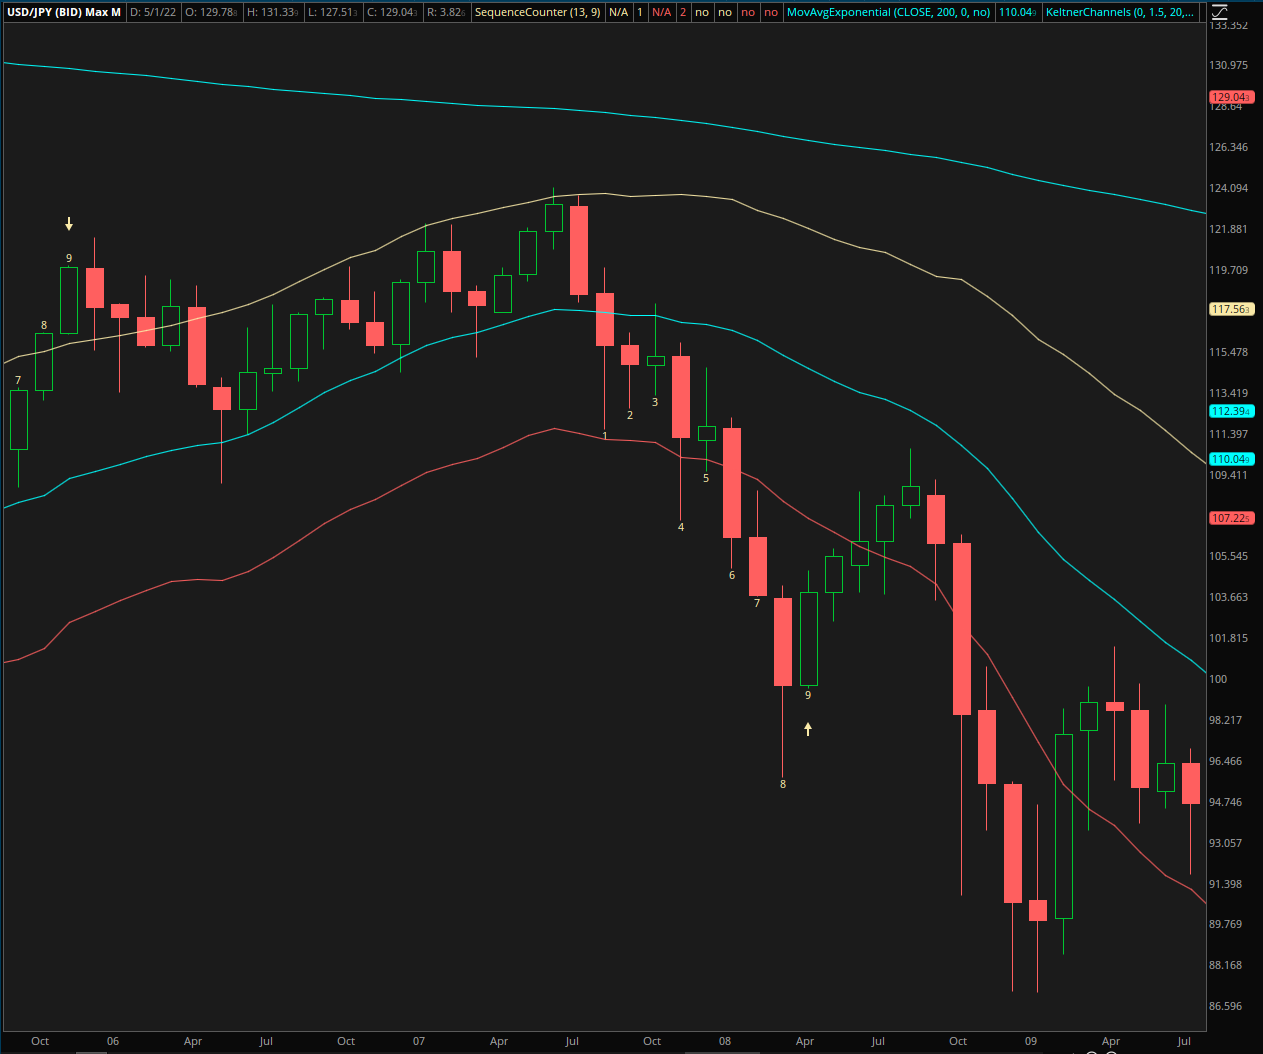
Here was a monthly chart of USD/JPY during the 2007-2009 bear market, in which the Yen appreciated nearly 30% from peak to trough:
I covered growing risks in the European Union on February 9th, and Japan on March 24th. Since the time of those pieces, the EUR/USD has declined almost 9% and USD/JPY appreciated almost 7%. Since mid-April, the US dollar has been a pervasive wrecking ball in currency markets, following a period since last autumn when its widely cited ‘strength’ was actually misattributed EUR and JPY weakness. For example, here was USD/CHF:
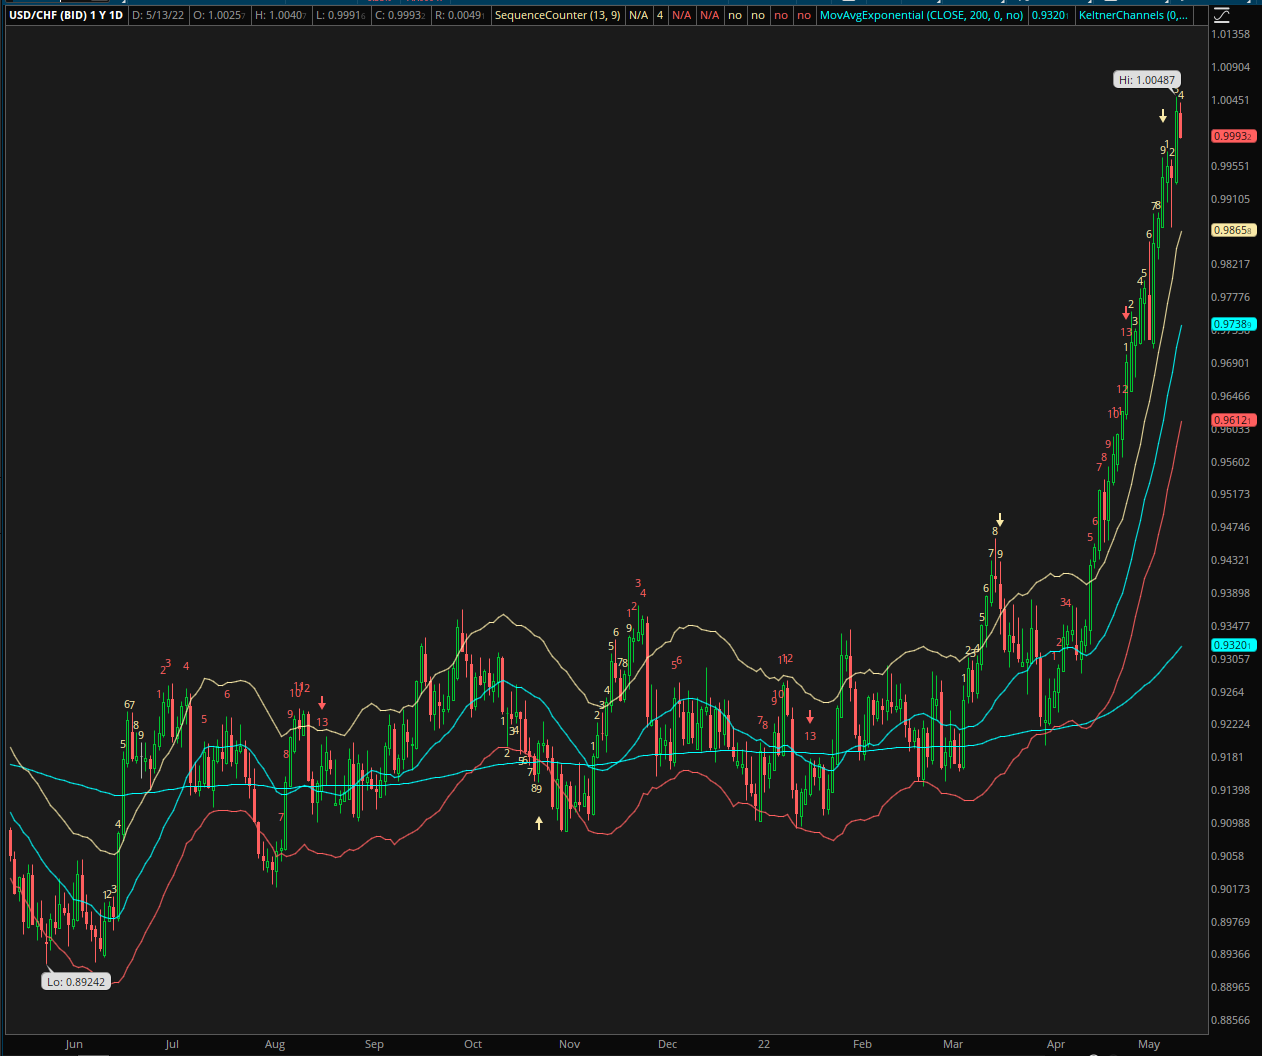
This one-year daily chart shows the currency pair had been relatively range-bound prior to the USD wrecking ball commencing in April. I will spare you a litany of other examples but could show a wide breadth of currencies ranging from the Norwegian Krone to the Colombian Peso, all showing similar range-bound moves prior to mid-April.
So why focus on Switzerland today? While 20th in GDP when ranking by nations, it is 3rd in GDP per capita, but 1st and 2nd are ‘microstates’ in Luxembourg and Macao. But along with the recent change in CHF behavior, the other thing about Switzerland which has attracted my attention is their central bank. It appears to have been operating as a pseudo-hedge fund for quite some time now.
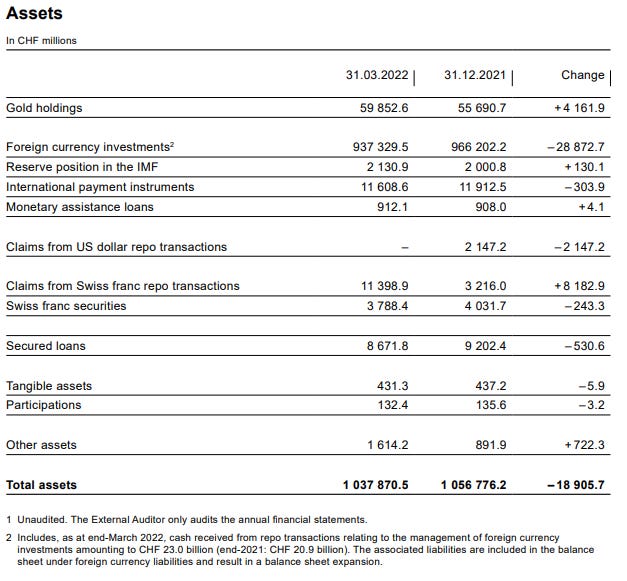
The series of images in CHF come from the SNB’s interim report as of March 31st, 2022. Total assets were just over 1 trillion CHF, with the bulk of that in foreign currency investments. Here was the equity position as of the end of Q1:

Oops - a 22%+ hit to equity!
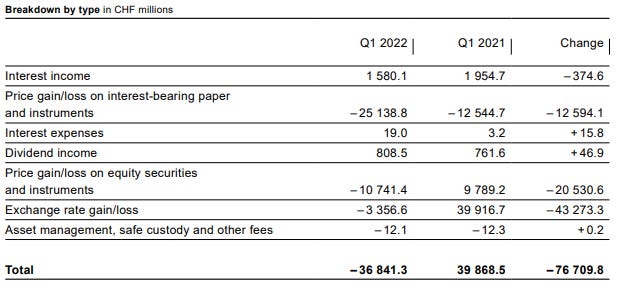
That graphic shows a breakdown of where their losses came from, with the move higher in interest rates, down in stock prices, and moves in currencies all conspiring against them.
I am not aware of a source for full transparency on the composition of SNB assets, but doing some relatively simple ‘backing into numbers,’ my guess is they may have incurred an additional 40+ billion in CHF losses in equity since the end of Q1 given the moves in global stocks, bonds, gold, and currencies. That would bring their equity position to down around 131 billion CHF, or down around 40% since the end of last year!
As bad as the problems are in Japan, this is why I go back to the CHF/JPY cross rate chart at the beginning of this piece. Following the failed attempt to peg the CHF to EUR, which imploded in 2015, and the pseudo-hedge fund operation unfolding at the SNB, the Swiss Franc ain’t what it used to be. A solvency issue is unlikely unless things get really wild in markets, and international bodies would probably step up to assist in a solvency crisis.
But with it getting harder for Nazis, warlords, authoritarians, oligarchs, and cartels to launder/hide money through/in their banks in recent years, could Switzerland be on a similar path as other long-past ‘financial centers’ such as Venice?
Thanks for this, “Nature Boy”. Any idea how long the Swiss central bank has been running this hedge fundesque operation? Has this behavior revolved over the last decade+ of helicopter money? Think I know the answer but thought I would ask anyway
I am not an expert on SNB history, but their Q3 2007 interim showed just under 50 billion CHF in foreign currency investments, but do not see indications of stock gains/losses. First time I see stock gains/losses being disclosed in a statement is for Q1 2009, when foreign currency investments were about 55 billion CHF, but without knowing when they actually started it is hard to back into how much they may have had exposed at the start. Imputing/guessing between Q1 and Q2 2009, it looks like they had about 1.5 billion CHF at end of Q2 2009, or about 1.8% of foreign currency investments. That appears to have grown with the balance sheet and as a proportion, as of end of last year to about 22% of a trillion.