

Where are We in Markets?
Where are We in Markets?
How to measure mania?

Last week was focused upon where the US economy appears to be relative to growth and inflation. A simple summary - the US growth rate entered a slowdown this summer, there does not appear to be enough evidence yet to suggest a reacceleration and there are potential early signs that the growth rate of inflation may be stalling out in the coming months.
Today will begin to review where we are in markets, which will attempt to distinguish between narrative, fundamentals, and delusion. The easy part is the fundamentals - the US market has never been this expensive. Ever.
Let’s start with two popular metrics for measuring broad stock market valuation levels, the Shiller P/E (otherwise known as CAPE) and the ‘Buffett indicator,’ which is market capitalization to GDP.
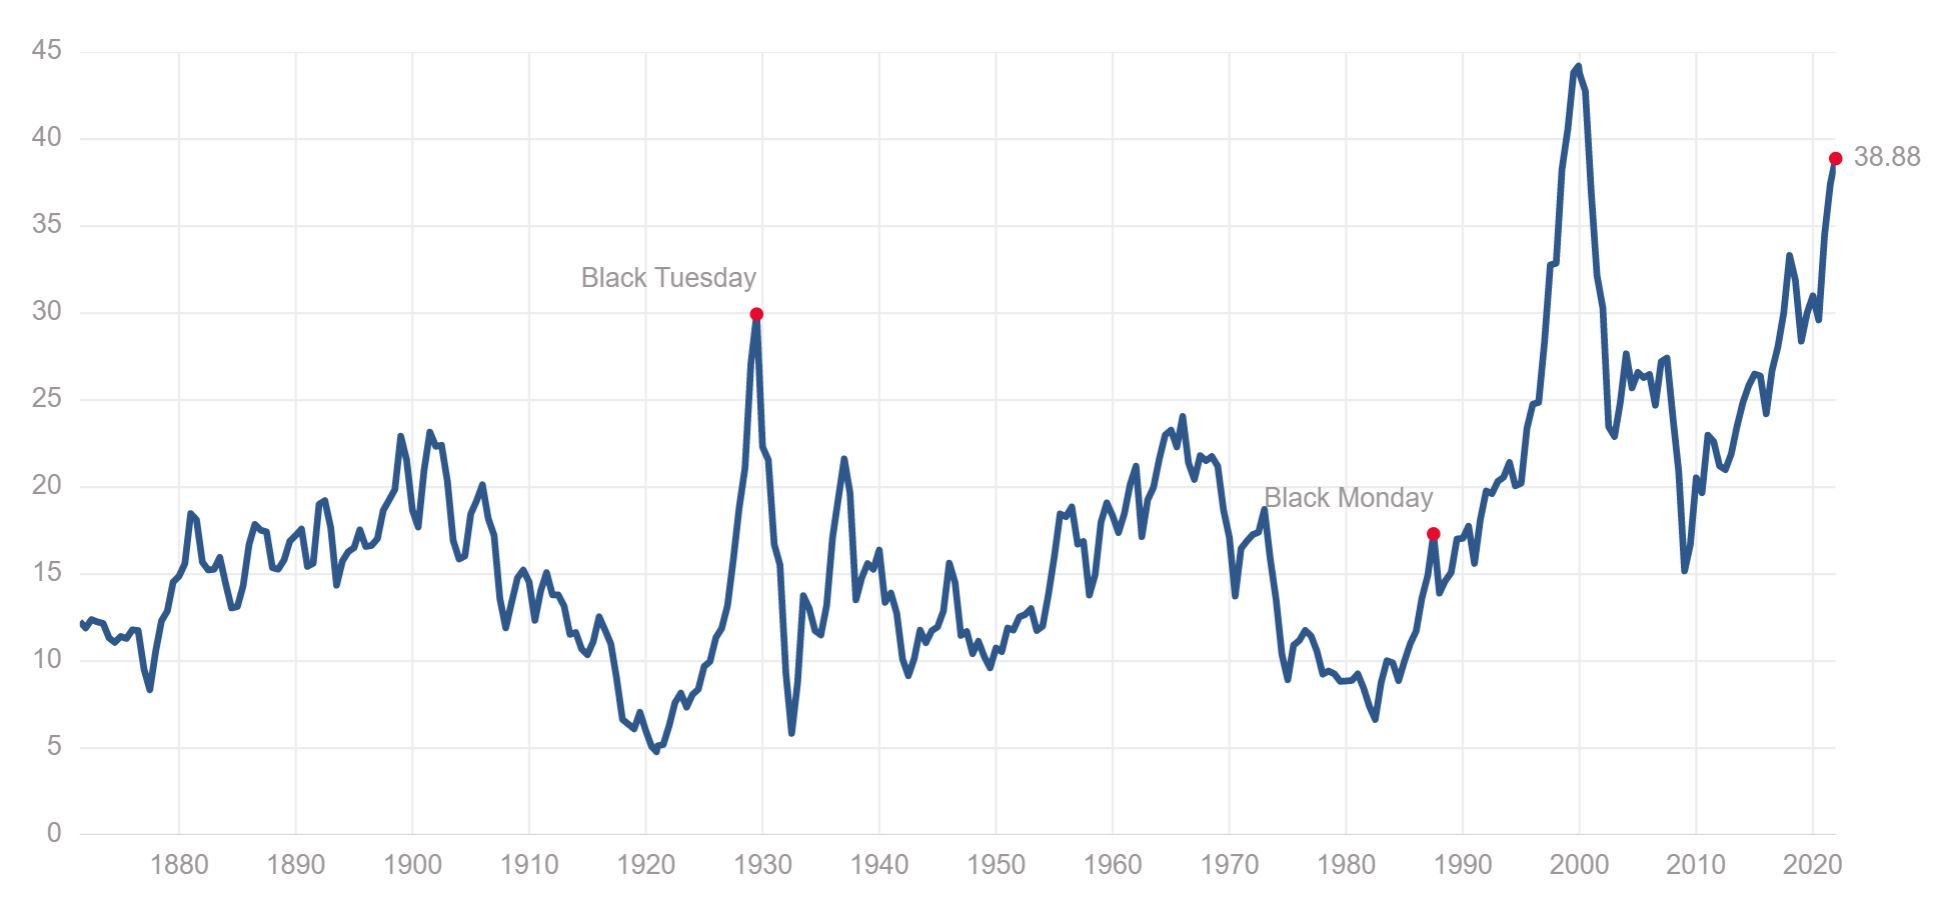
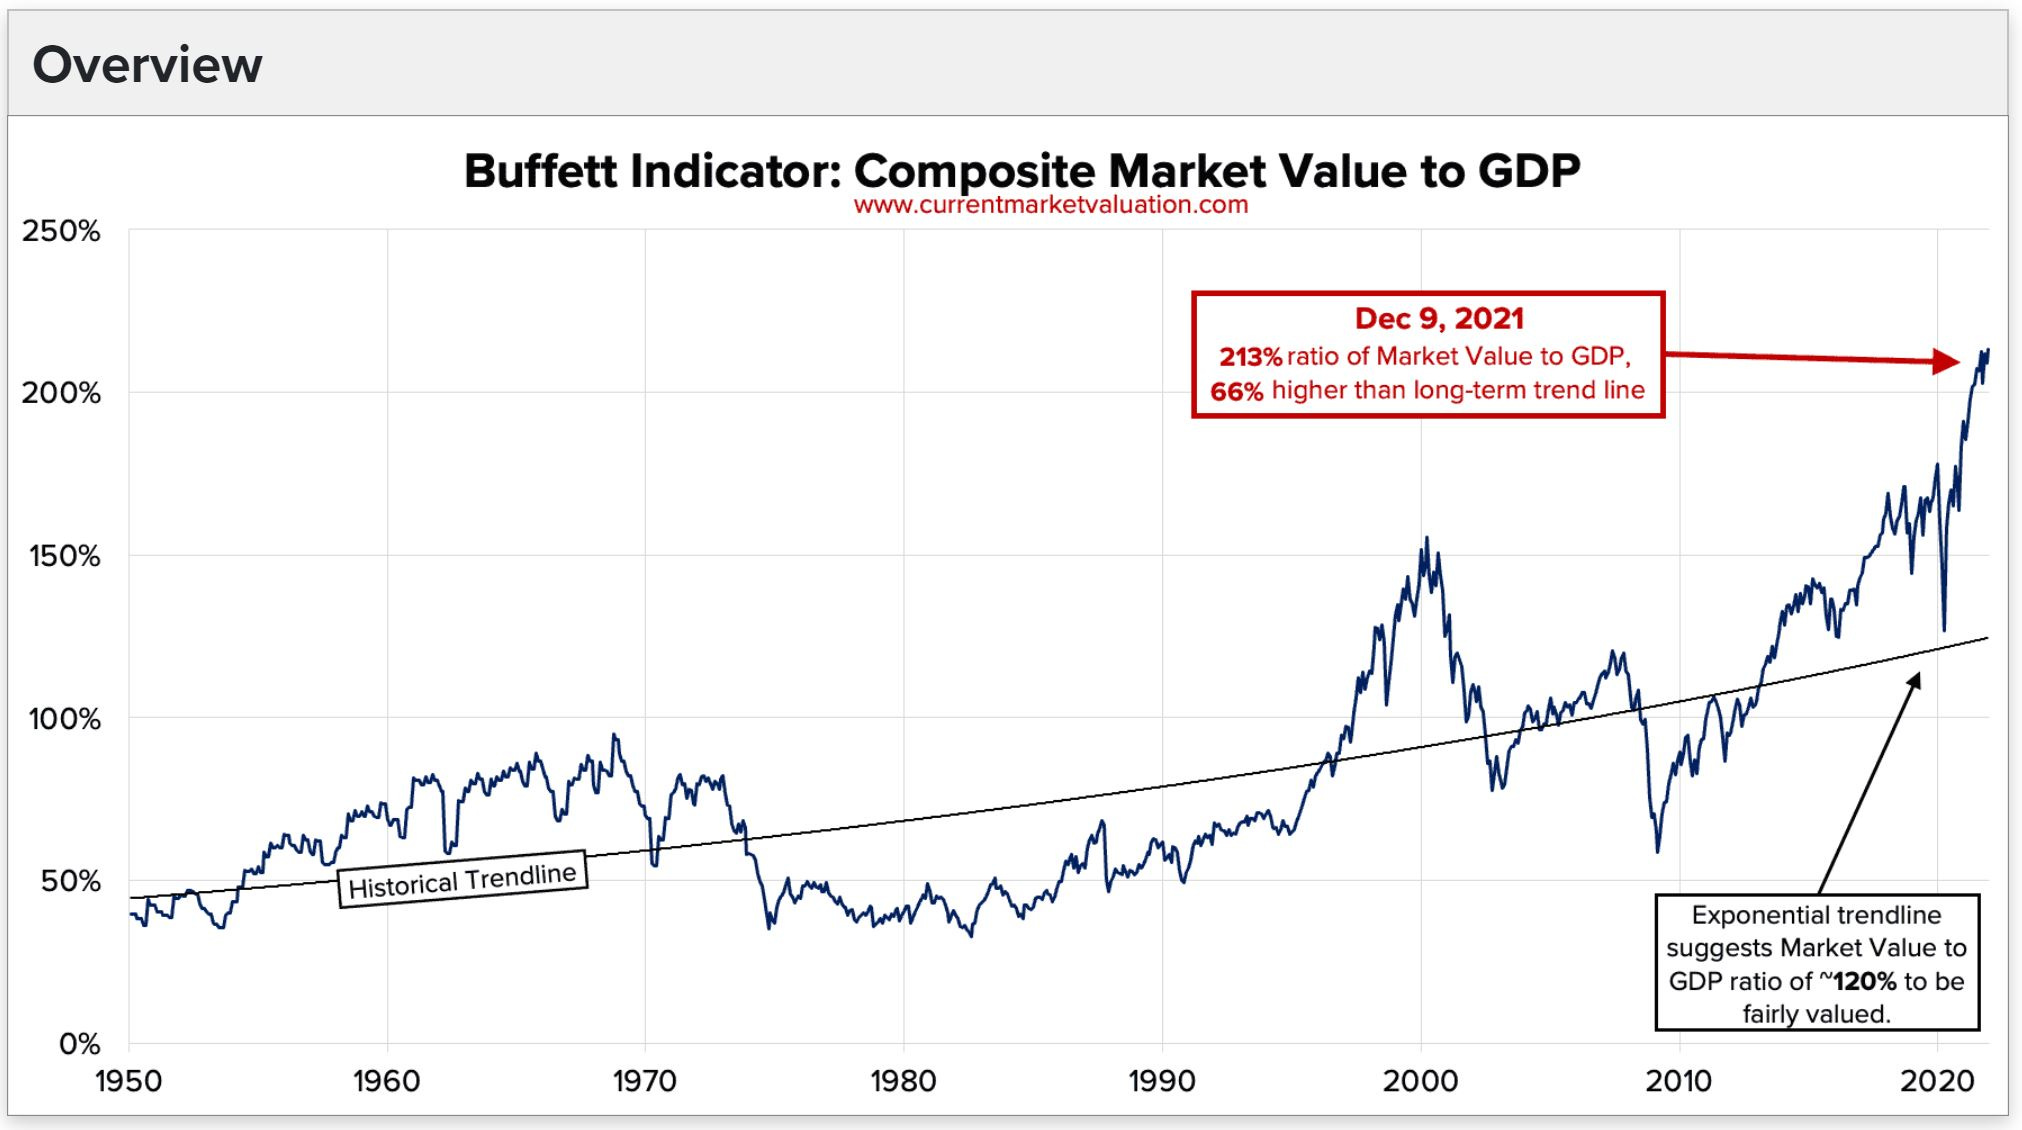
Unlike the Fisher equation for the bond market, which I covered on December 2nd, there are a large number of competing valuation models for the stock market. Unfortunately like the Fisher equation, the Buffett indicator is perverted by the fact that reported GDP is impacted by the ‘fake’ inflation metric. In addition, Shiller P/E is impacted by what comprises the denominator - earnings.
Here we see that corporate profit margins have been elevated since around 2005, with the 10-year lookback period of the Shiller P/E mostly above 10%. The 10 year period preceding the 2000 peak in that mania had much lower profit margins embedded.

I am referencing multiple charts from John Hussman, who offers valuable and free information weekly via his fund’s website. His track record as a money manager has been extremely poor over the past two decades, as he’s struggled to navigate the era of kayfabe, but his weekly ‘newsletter’ offers insight into what Ben Graham called the ‘weighing machine’ - i.e. fundamentals.
When we balance out some of these factors and look towards other metrics, I believe the picture becomes clear - we are not in Kansas anymore, Dorothy.
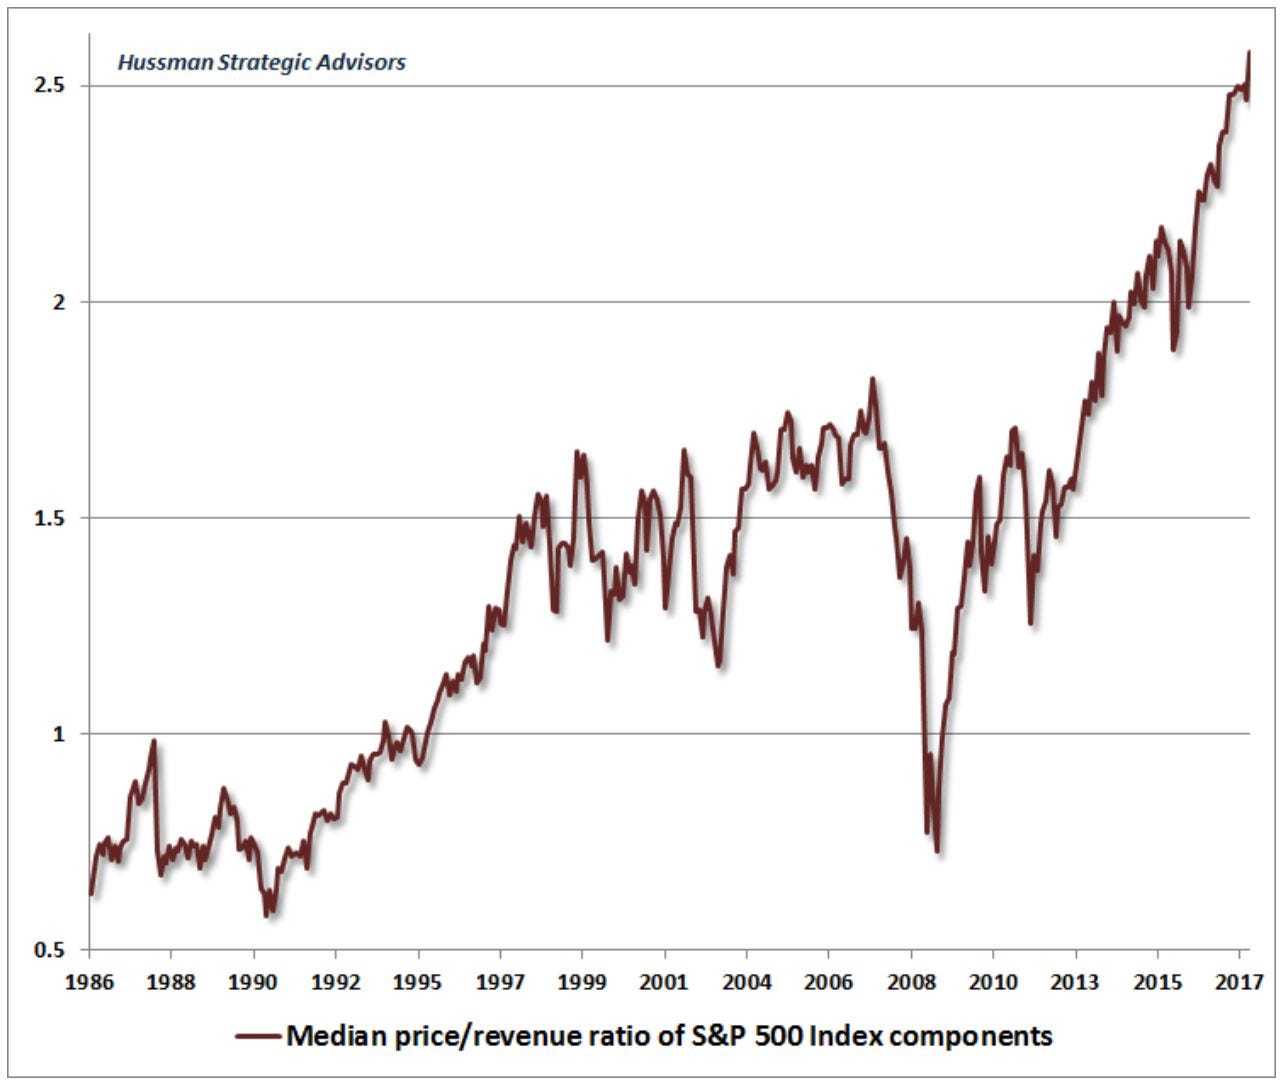
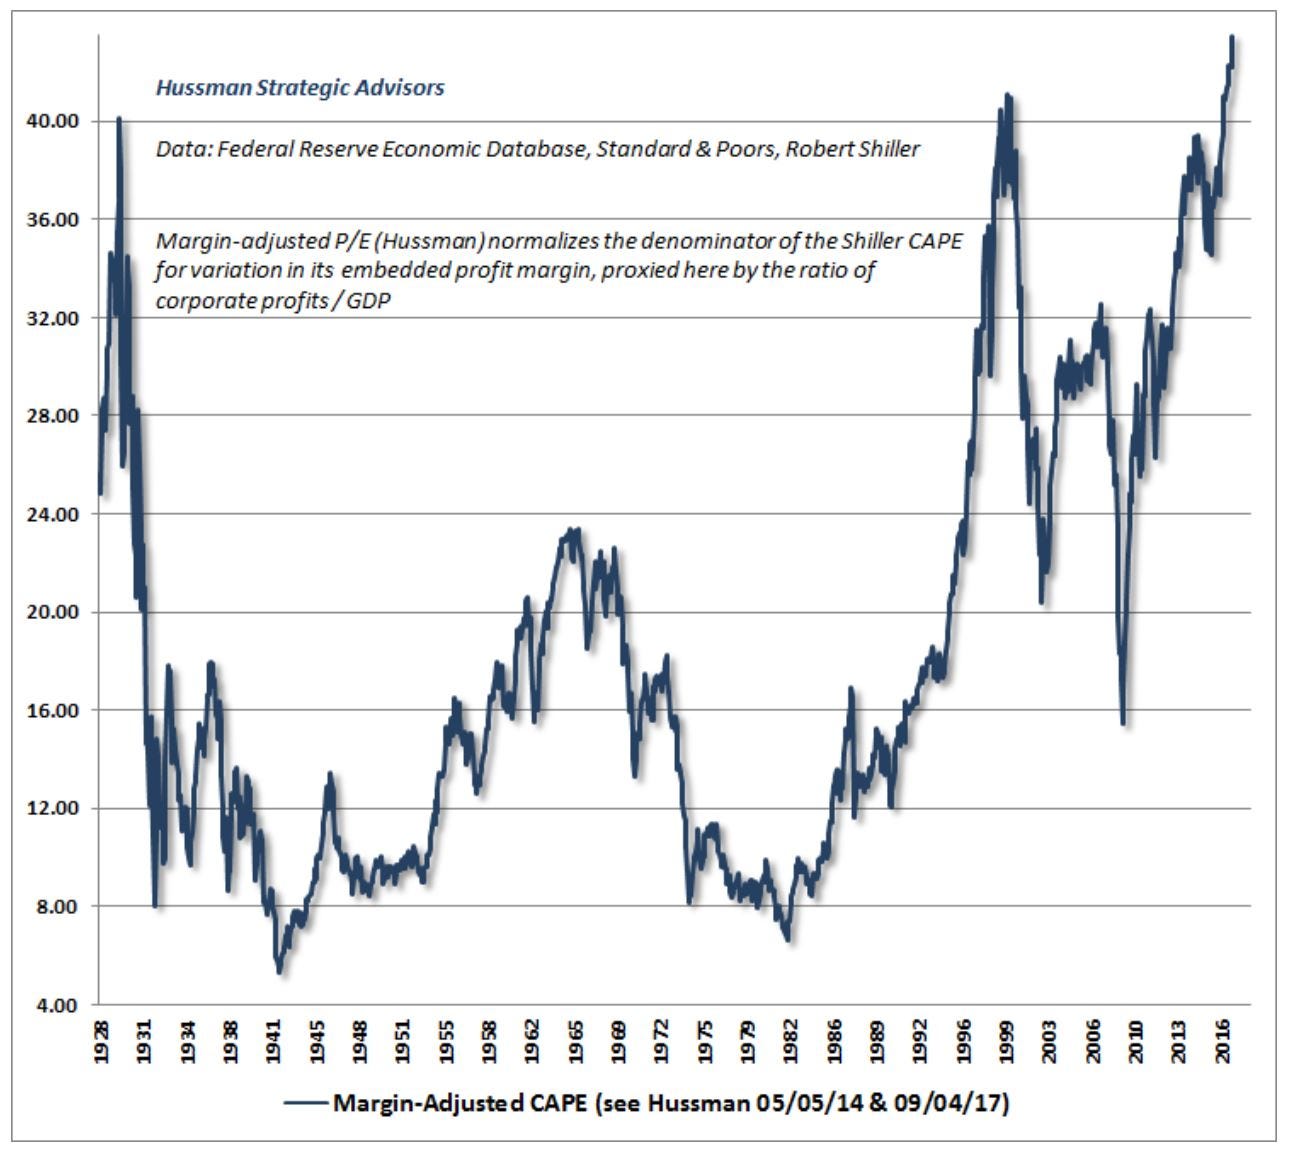
The median price to sales ratio above is important, as it gauges the pervasiveness of the overvaluation, whereas, in 2000 or even the Nifty Fifty of the early 1970’s, crazyville valuations were more focused on specific market segments. Hussman shows the Shiller P/E adjusted for profit margins relative to GDP, which I would argue is better, but still includes the impact of ‘fake’ inflation data.
So the weighing machine shows that prices relative to value are in full-blown mania. This has huge implications for forward long-term returns.
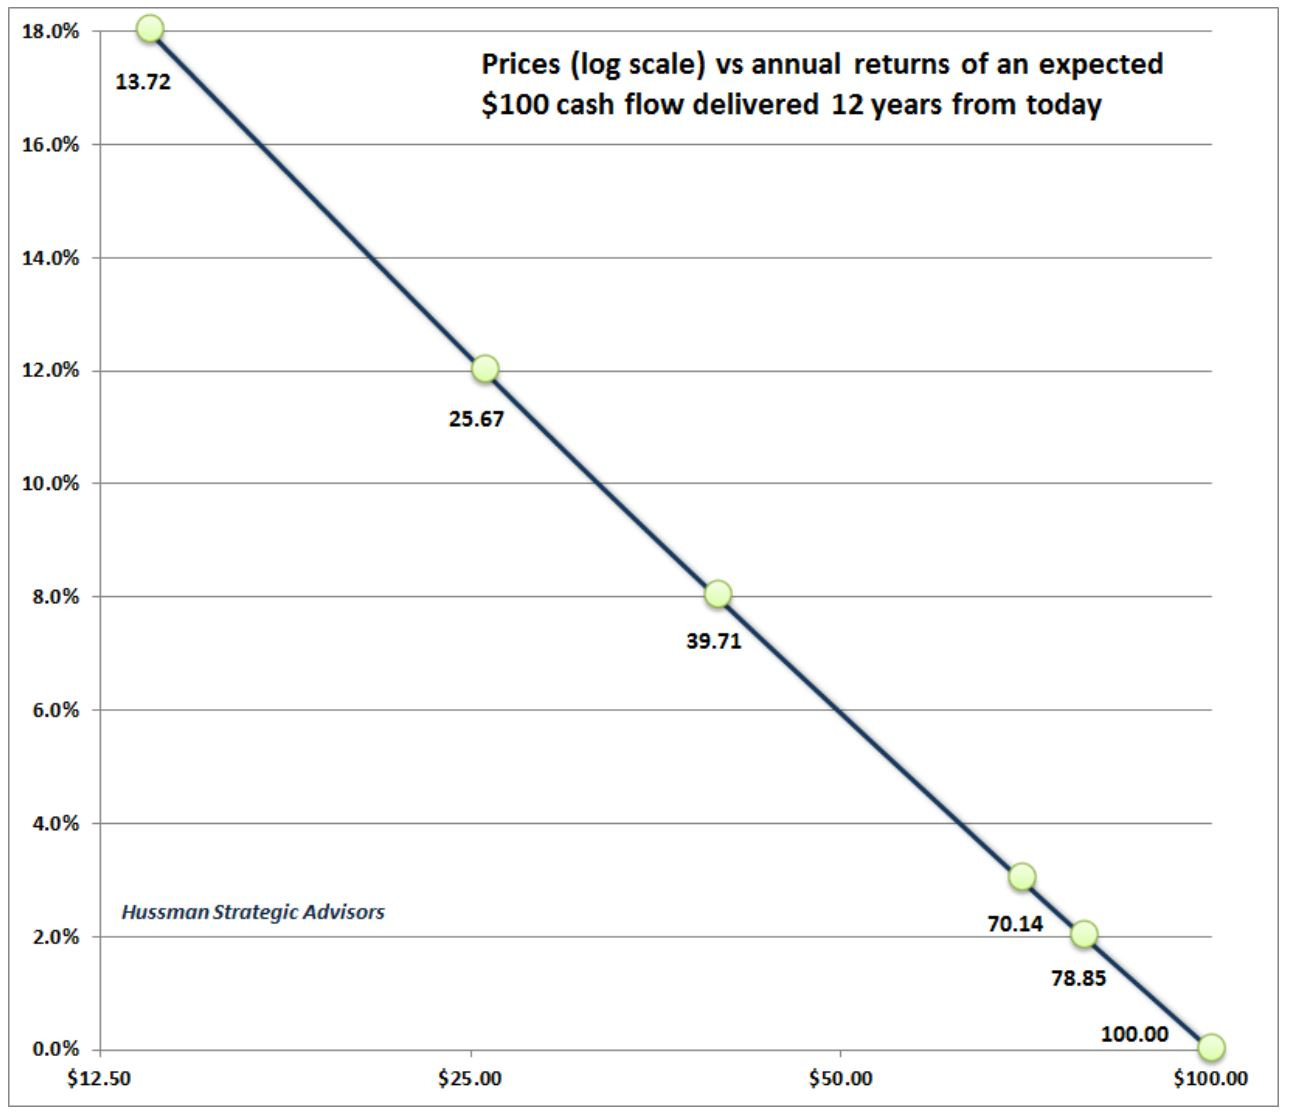
Here we can see how 12-year returns conform to a sort of ‘investing Zipf’s Law,’ where ignoring the initial conditions relative to extreme valuations is unwise. Yet as part of the mania, the vast majority of large institutional investors, most of whom are supposedly fiduciaries, are either ignorant too or ignore this fundamental issue.
Let’s do some simple arithmetic to provide context. The current S&P 500 ‘sales per share’ is about 1,500 and earnings per share about 162 - both annualized. That results in about an 11% margin, which is reflected in Hussman’s graph above. Assume nominal GDP grows at 6% per year (has been around 4%-5% since 2000) over the next decade, but that profit margins revert to 8%, and Shiller P/E goes back to 20, both of which would still be elevated historically, and we get the following:
1,500 at 6% per year for 10 years = 2,686 in sales per share
8% profit margin on that sales = 214.90
Valuation multiple of 20 times = 4,298
Yesterday’s close in the S&P 500 cash index was 4634. The dividend yield on the largest investable ETF for the S&P 500, symbol SPY, was 1.30% as of yesterday’s close. That is what they call returnless risk, in my opinion. The 5 year and 10 year US treasury yields closed yesterday at about 1.24% and 1.45%.
The mania is less severe outside of the US, but then various conditions are also worse - lower trend growth, worse demographics, higher debt levels, etc. The Vanguard All-World ex-US (VEU) ETF has compounded at 7.6% over the past 10 years, compared to 16.5% for SPY.
None of this means anything in the midst of a mania, until it does. Next week I will focus on the ‘voting machine’ and how the US may be analogous to ‘the Brazil’ of the 2008 cycle, and how a sandpile may offer more clues to how this ends than anything shared today.