

Where are We in US Economy?
Where are We in US Economy?
A business cycle perspective

Where are we in the business and inflation cycles? This week is dedicated to trying to assess where the US is at relative to those two separate cycles.
As for the business cycle:
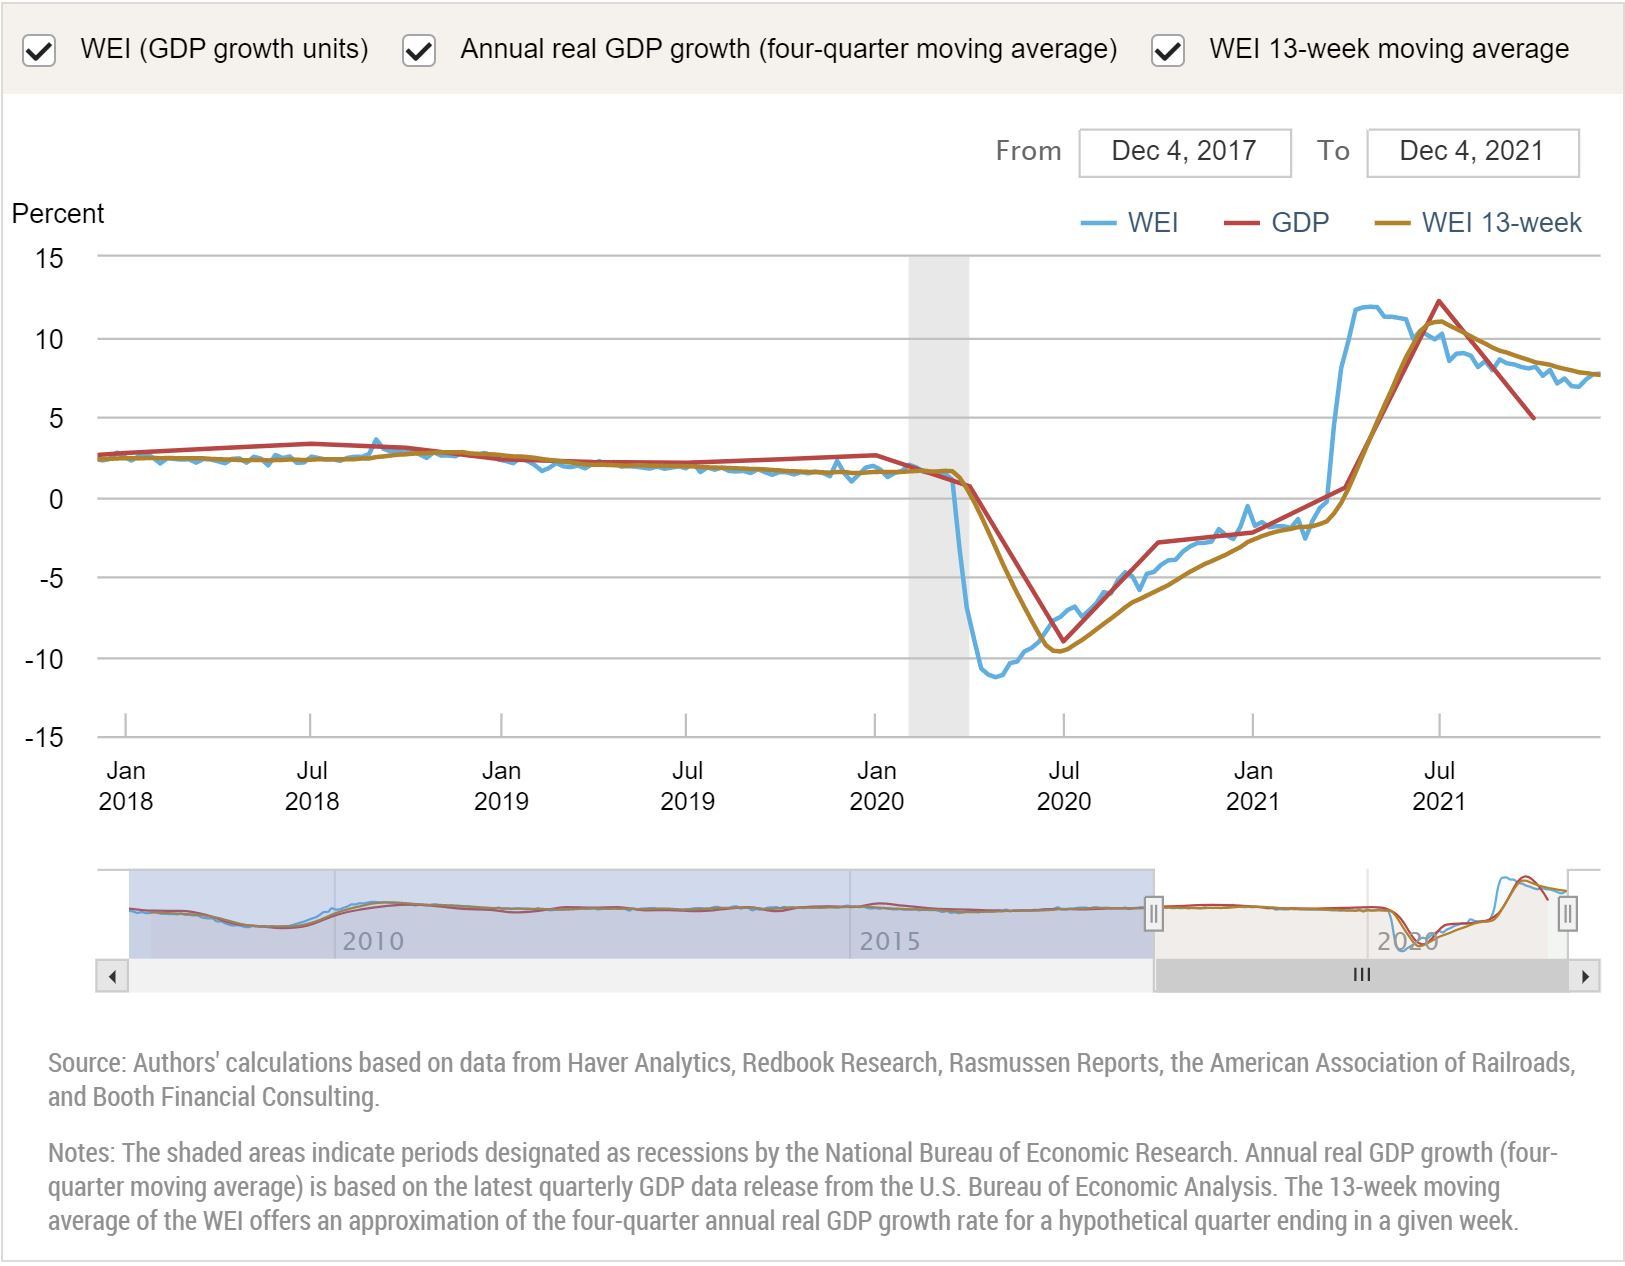
The first chart shows the Weekly Economic Index, which was created by and available publicly from the New York Federal Reserve Bank. Here is the index zoomed in from just prior to the pandemic:

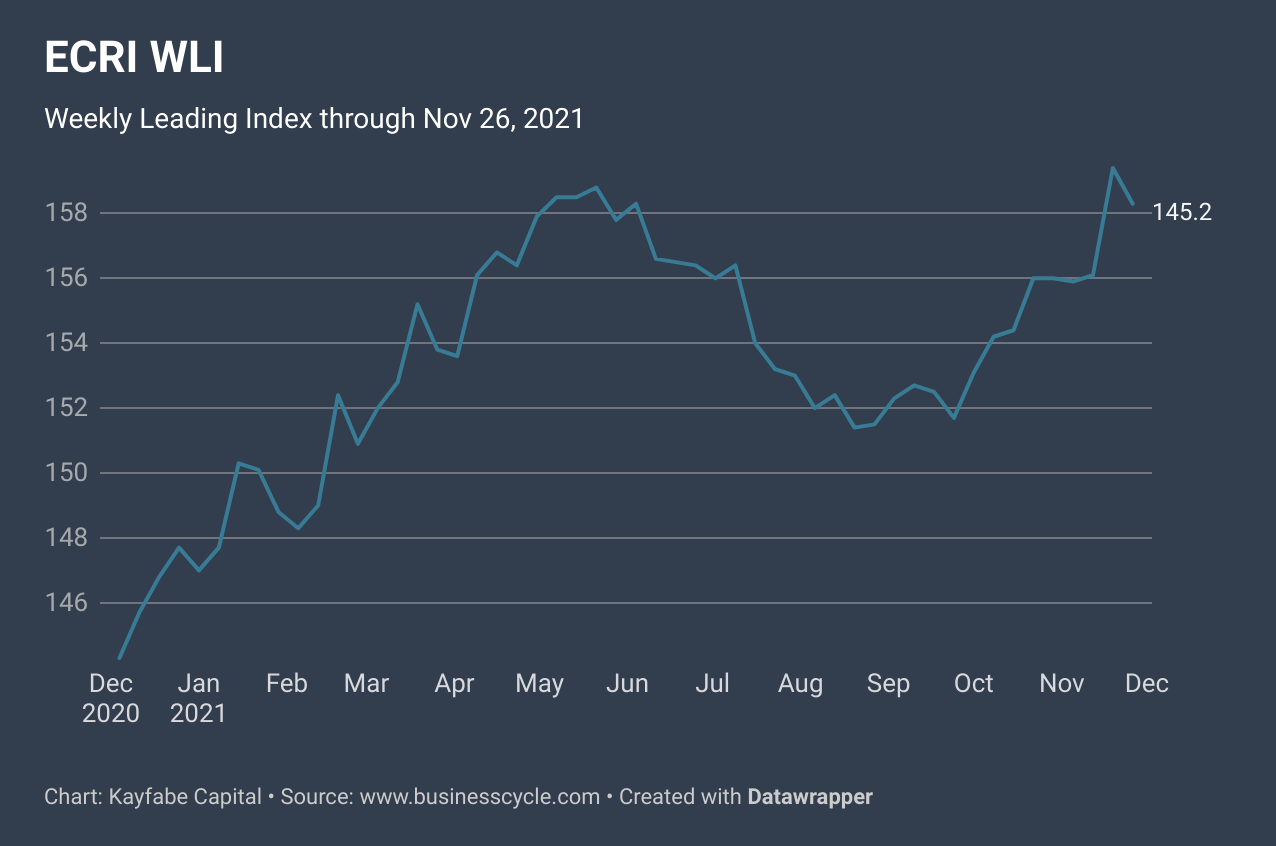
I’ve been tracking and using Economic Cycle Research Institute (ECRI) leading indictaors for about two decades. They offer their Weekly Leading Indicator for free to the public with one year of trailing history. Here are the most recent index level and associated growth rate - I have created the charts using their data:
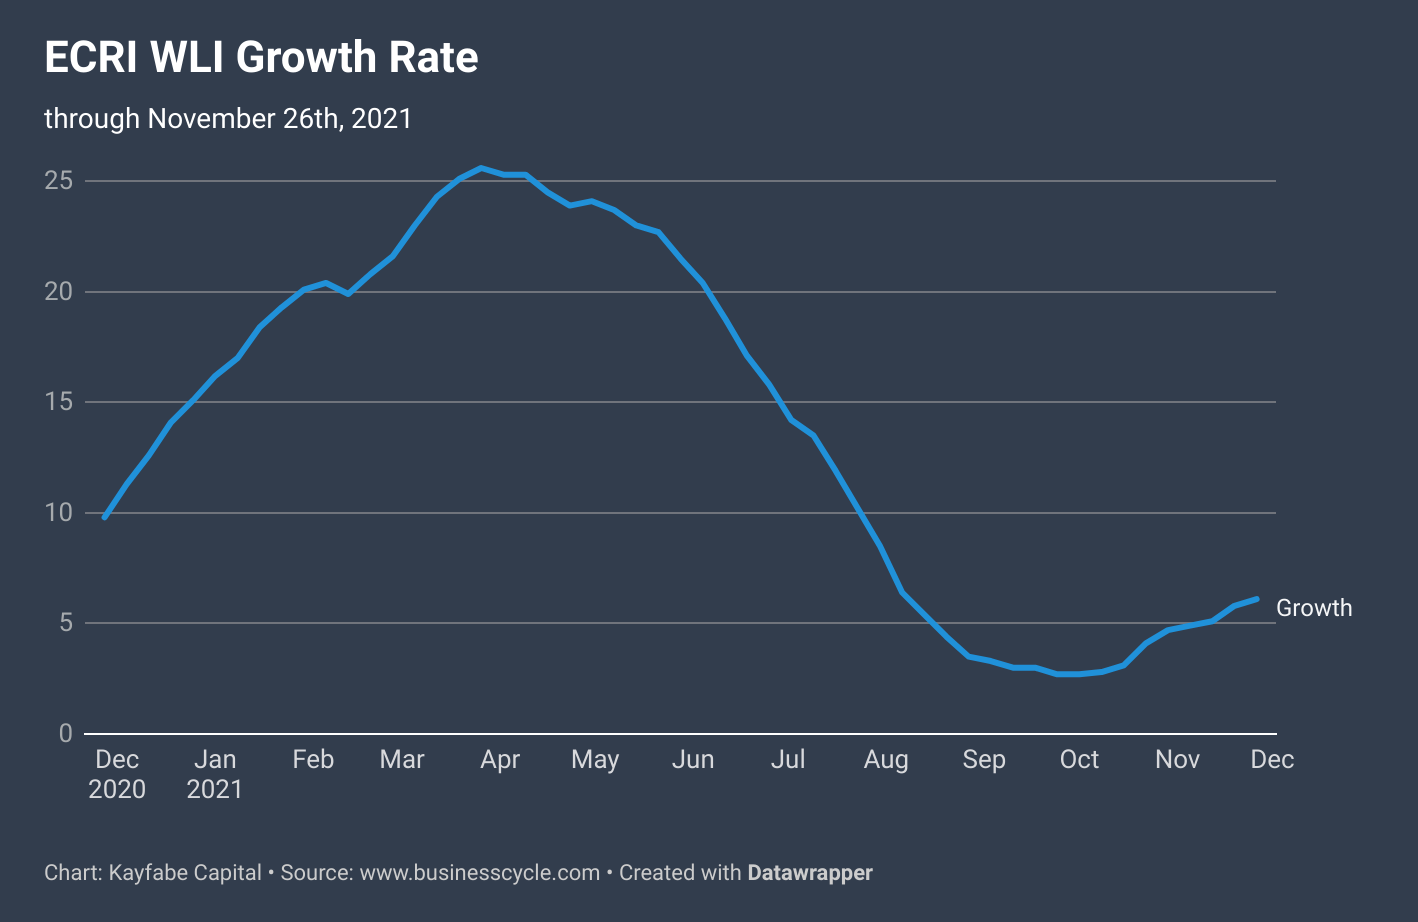
We can see from these various metrics, that higher frequency economic data started to suggest a slowdown in the US economies’ growth rate starting in the spring. This coinceded with a forecast by ECRI of a global industrial cycle downturn, which to date remains intact within the public domain. The higher frequency US data has stabilized a bit recently, but the growth rate remains early in a potential recovery - “potential” being the key word.
What is the importance of this? Outside of the unusual circumstances of pandemic-induced lockdowns creating a collapse in economic activity, recessions are typically preceded by growth rate cycle downturns. Not all growth rate cycle downturns result in recession, as some are mid-cycle slowdowns amidst prolonged expansions. Here is ECRI’s own long term chart, available on Lakshman Achuthan’s Twitter feed:

We can see there were four mid-cycle slowdowns following the global financial crisis, but none of which were poised to lead to recession until the pandemic hit. Here is another recent chart shared by Lakshman:
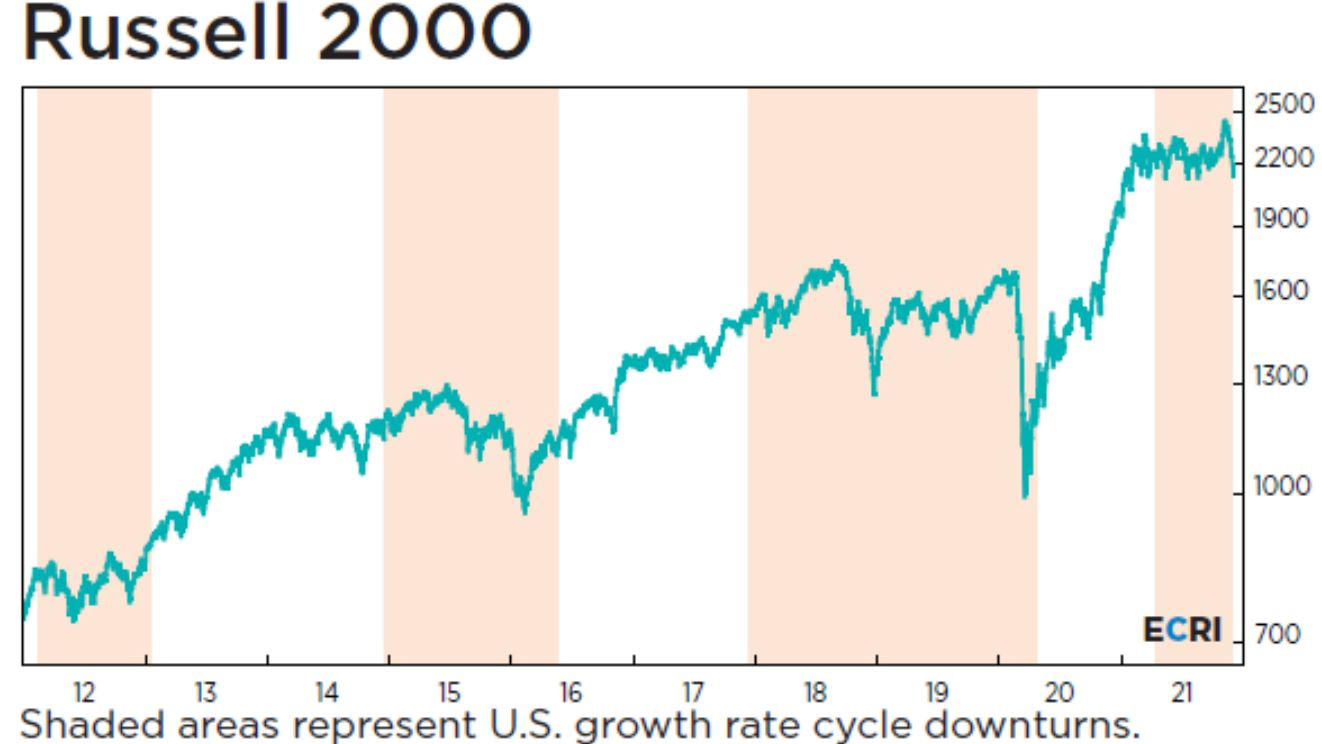
It shows how the Russell 2000 US small cap stock index has responded during recent growth rate cycle downturns. If you look at the prior chart and peer toward periods in which significant stock market corrections/crashes occurred, they were typically amidst growth rate downturns: 1987, 1994, 1998, 2002, etc.
ECRI’s forecasting process is leading indicator-driven, and I no longer have access to the full suite. Most importantly, the business cycle is discrete from the inflation cycle, and their important Long Leading Index (LLI) is not public. The sequencing of cycle forecasts typically has the LLI turn down/up, followed by the WLI, and then coincident data. They have not made a public recession call and have hinted recently that they are monitoring for when the growth rate cycle may end.
In reading the tea leaves, this suggests to me that the LLI has not turned down in a recessionary fashion to date, and if the recent buoyancy in the WLI persists, the US growth rate cycle downturn could conclude.
Unfortunately, ECRI’s Future Inflation Gauge (FIG) is also not publcly available, but they’ve recently been public in suggesting a cyclical downturn in the inflation cycle is unfolding. In addition, here is the New York Fed’s Underlying Inflation Gauge (UIG):
This shows the recent cyclical upturn in inflation which has now become widely discussed. A similar gap opened up in 2007-2008, which obviously did not precede a sustained inflationary period. Friday’s key inflation data reports could offer additional clues as to whether the growth in the inflation cycle may be peaking.
Next week I will focus on where we are in markets, but here is a quick preview:

Is it possible or likely for risk assets to weaken considerably if the US economy reaccelerates?