

Bueller's Business Cycle
Bueller's Business Cycle
Recession? Anyone? Anyone? Anyone?

I have been active on Twitter the past couple of weeks pointing out that the current business cycle is NOT 2008. A lot of economic data reports have come out, and the present appears a good time to once again pull together a variety of topics covered in past The Worked Shoot.
I want to stress upfront, that the business cycle is NOT the same as the financial markets, though they typically do interact with one another in reasonably reliable ways over time.
The Global Financial Crisis (GFC) recession was centered around the financial industry imploding, which proceeded to cascade into the broader economy. The 2020 panic served as a sort of confirmation bias, as many people understandably freaked out when the financial system seized up in March 2020 amidst the pandemic’s onset.
This has created a situation tantamount to many investors figuratively gazing out concerned over a dark rain cloud over the Gulf of Naples in early autumn 79AD, with it reminding them of the ‘big storm’ that caused horrible flooding years prior, despite this starting behind them:

Here is a graph of the US ISM manufacturing new orders index over the past 20+ years:
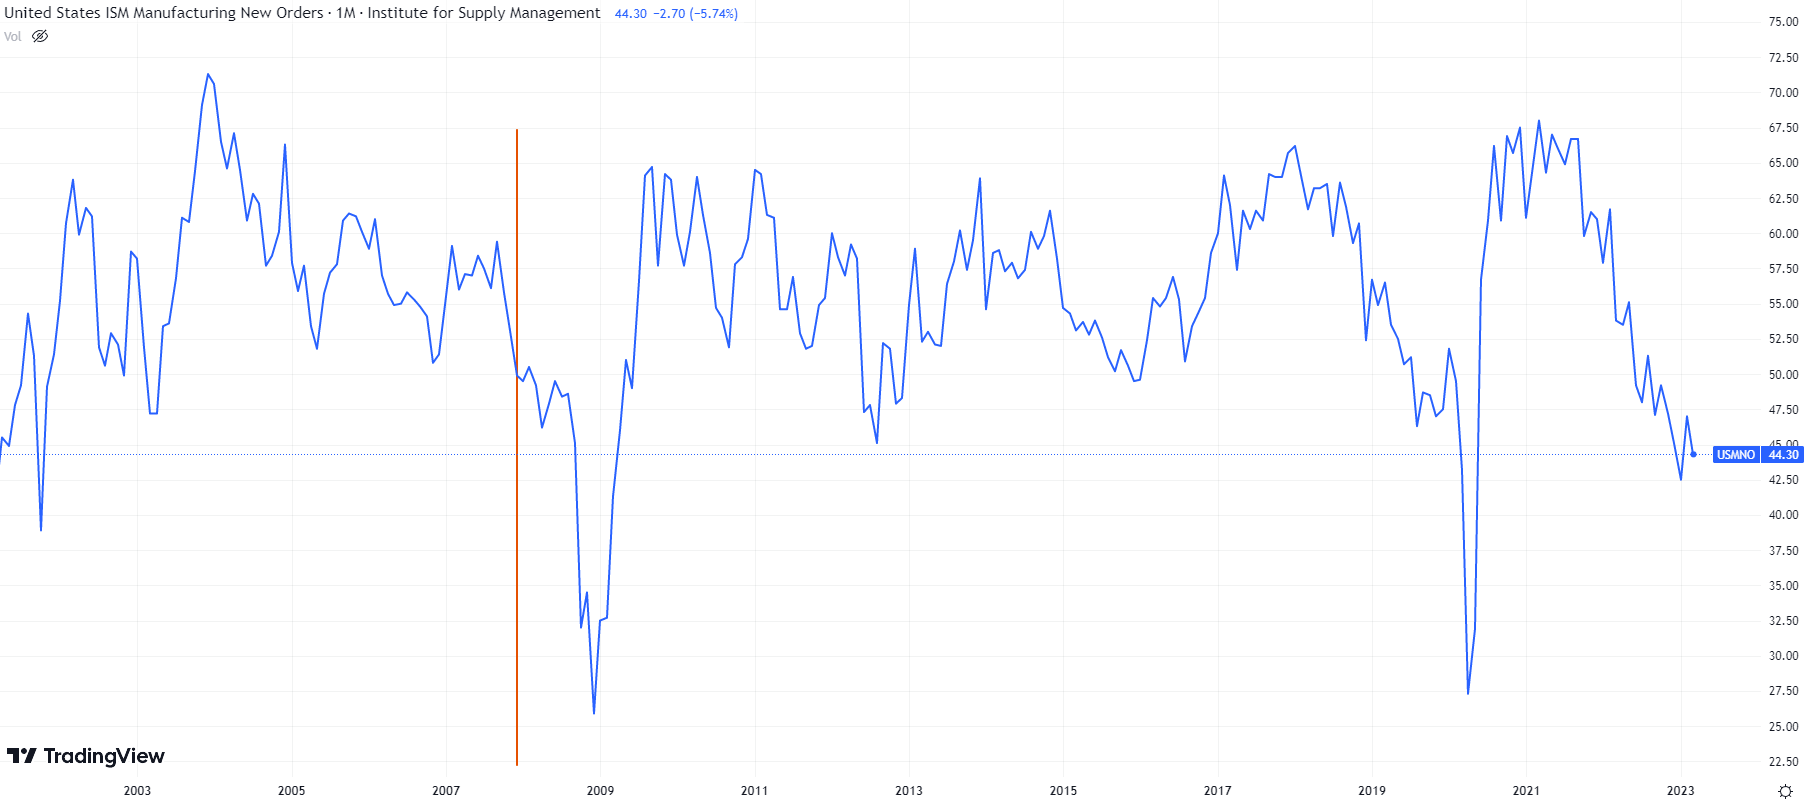
Many widely discussed economic reports are diffusion indexes and designed to offer insight into that part of the three D’s - diffusion, depth, and duration. Those are conceptual criteria used in business cycle analysis. An ISM/PMI index reports on the breadth of a part of economic activity.
In this case, it tries to measure the breadth of expansion or contraction across various segments of the manufacturing industry specifically for new orders. To try and explain further, assume there were 10 segments and 6 reported expansions, and 4 contractions, that would create a positive ‘breadth’ and result in an index value above 50, which is typically the level of demarcation.
We can see from the graph where the new orders index is for the month that the GFC recession began (vertical red line) in December 2007. Here is the level of total business inventories across the US over the same period, again with a red line marking the start of the GFC recession:

This next graph shows the rate of change in inventory levels, again with the red line:

We can see from these graphs that the GFC recession began while manufacturing was still expanding, and that the slowdown in the economy initially built up inventories until the recession turned nasty later in 2008. The “Lehman moment” manifested in the economy going into acute free fall. That was tantamount to the “big storm” that caused all the flooding.
In this cycle, the script is flipped. The explosion in goods-centric spending amidst massive government stimulus, combined with supply chain issues, has the manufacturing sector leading this cycle. Go back up to the graphs above and take a fresh look at where things currently stand, and how the graphs have been evolving in recent months. Diffusion indexes have plunged into contractionary levels with a couple of recent exceptions. Here is the New York Empire:
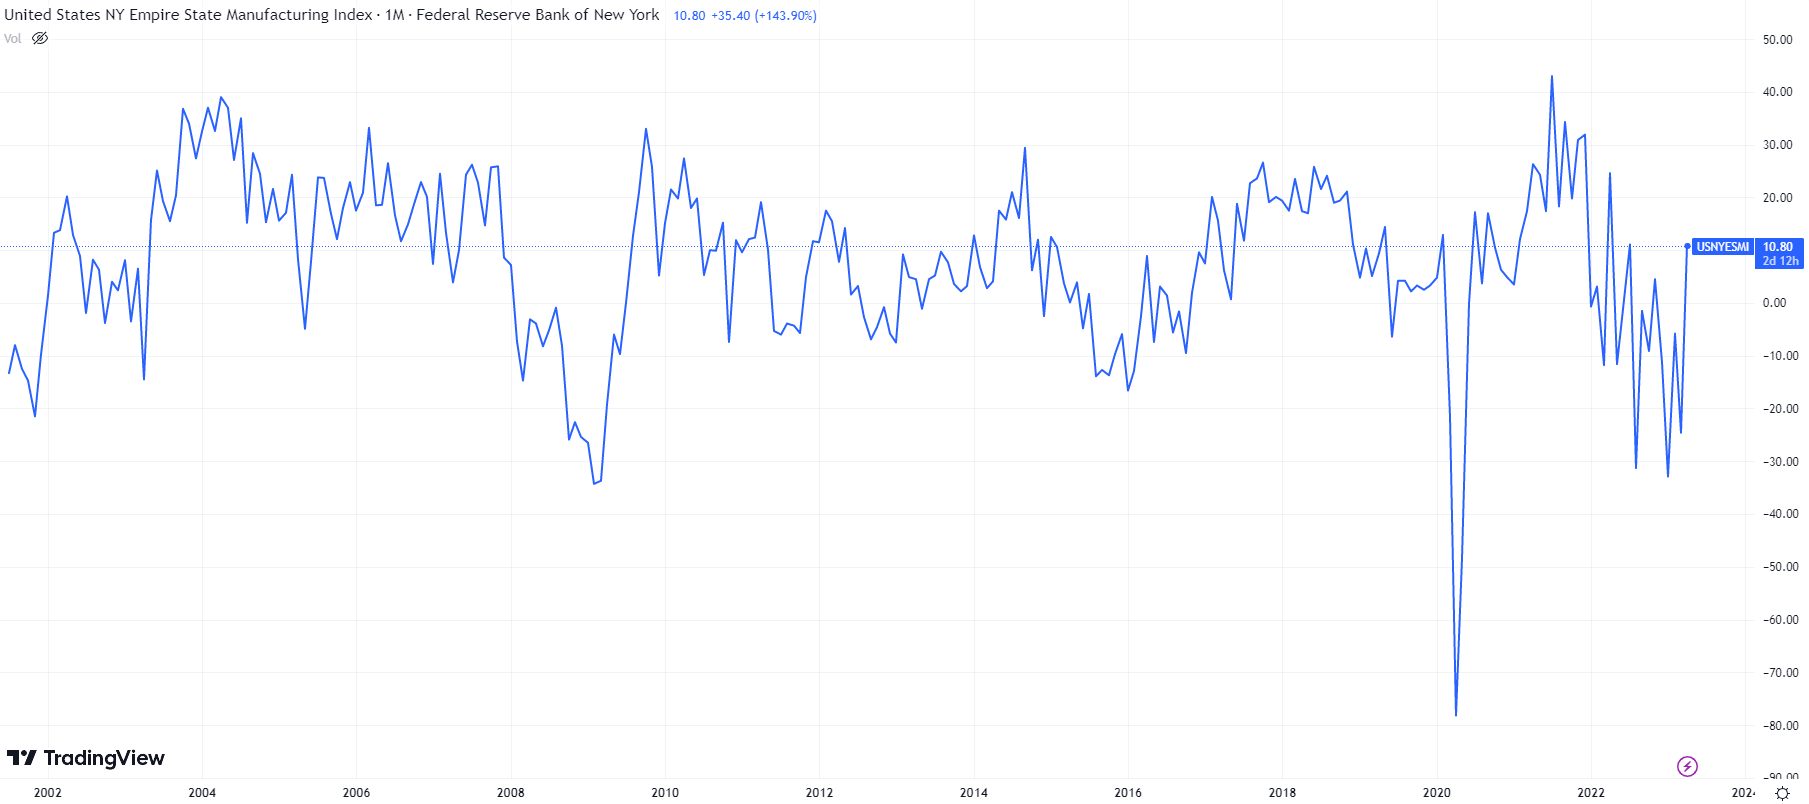
Multiple Federal Reserve district banks keep regional diffusion indexes, and New York’s spiked back above the threshold into ‘expansion.’ However, remember that diffusion indexes do not measure depth! Back to my simpleton example, if 6 segments are expanding at 1% each, and the 4 contracting are doing so at -10% each, then diffusion can be positive while overall depth could be negative.
I will not belabor the point by showing all the regional indexes, but here are manufacturing and new orders for Philadelphia, with Dallas, Richmond, Chicago, and Kansas City all looking more like it than New York:
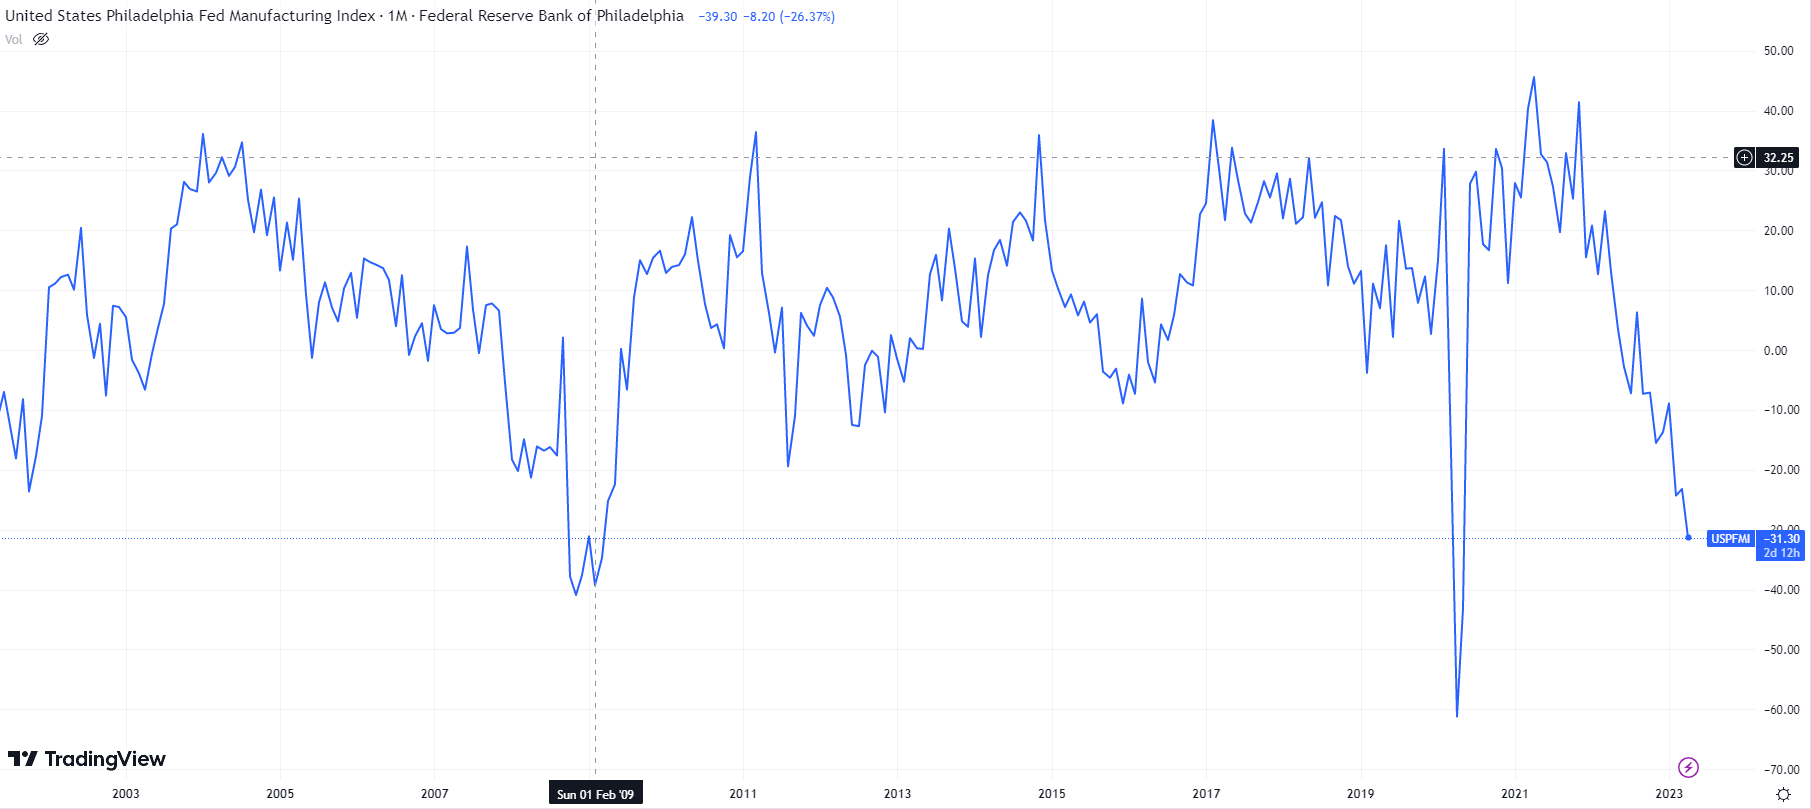

If we piece all these graphs together, we get the following picture, in my opinion:
Inventory levels remain high
The rate of inventory build is decelerating but not yet contracting
The deceleration has started various Mack Attack
As laid out in the linked Mack Attack piece, the impacts through the economy are non-linear as demand weakens. Here is the trend in shipping container volumes at US ports, courtesy of Ayesah Tariq:
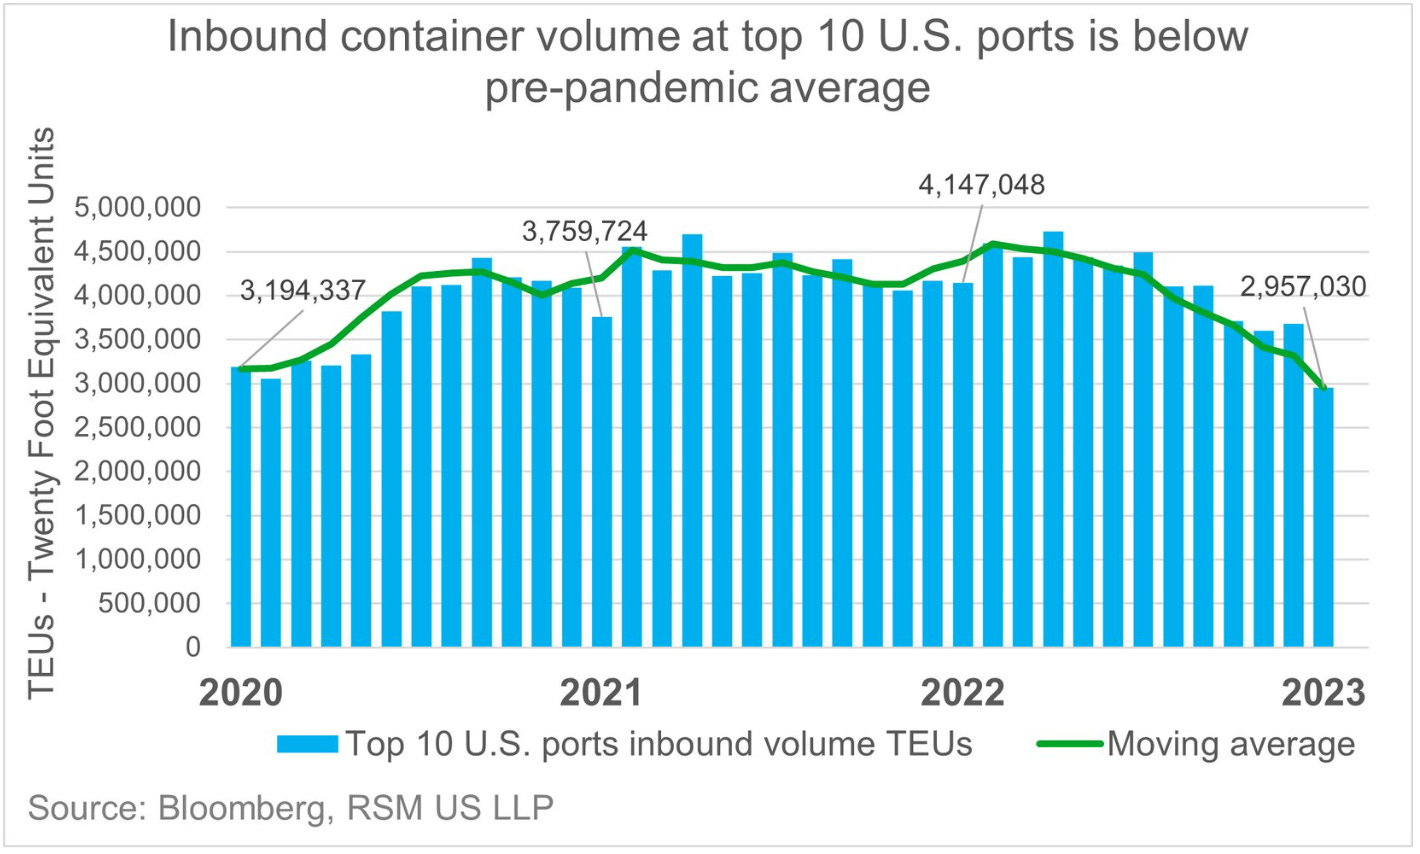
Here is a graph of Packaging Corp’s box shipments courtesy of FreightWaves via Steve Cortes:

Craig Fuller of FreightWaves is an excellent follow on Twitter, and has been chronicling the trucking industry recession already fully underway. All this industry carnage is taking place BEFORE broad-based inventory liquidation has transpired. What happens when/if it does?
Of course, manufacturing is just one part of the economy, and an important element within the production leg of the business cycle table - income, sales, and employment being the others. Relative to income and related spending (i.e. sales), these graphics and analysis from @hump_bear via Twitter (shared with permission) are indicative of where the US consumer cycle is:
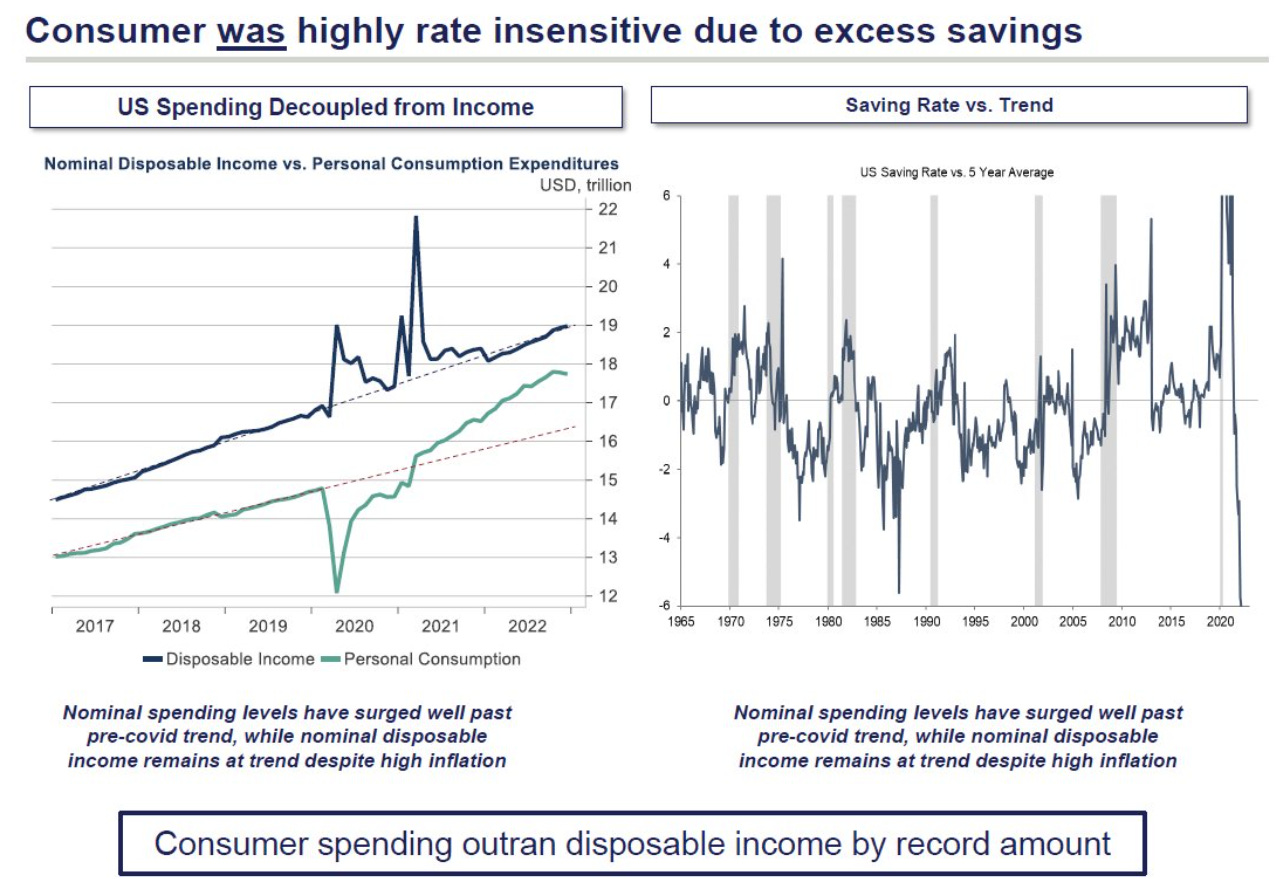

The ‘excess savings’ from pandemic-era stimulus have buttressed the consumer, but the savings rate plummeting is indicative of the cost of living crisis making a huge dent, as the gap between real and nominal disposable income in the graphs display. Of course, the excess savings are not distributed equally across the population, so more and more people have been exhausting reserves and turning to borrowing:
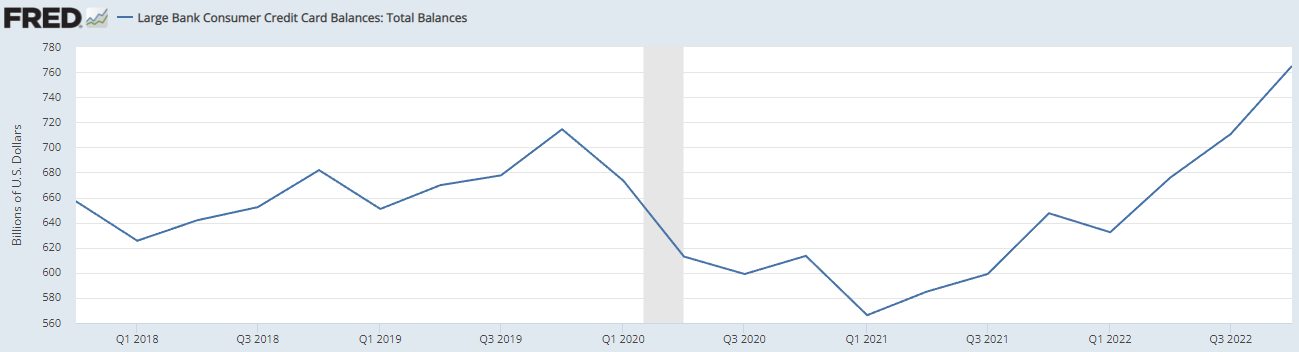
Just as a potential tipping point in excess savings being exhausted is reached, banks are…..

raising standards to lend! That graph is only through the end of 2022, so it does not include any impacts from the recent banking crisis.
This Total Bank Credit metric is reported weekly and does:
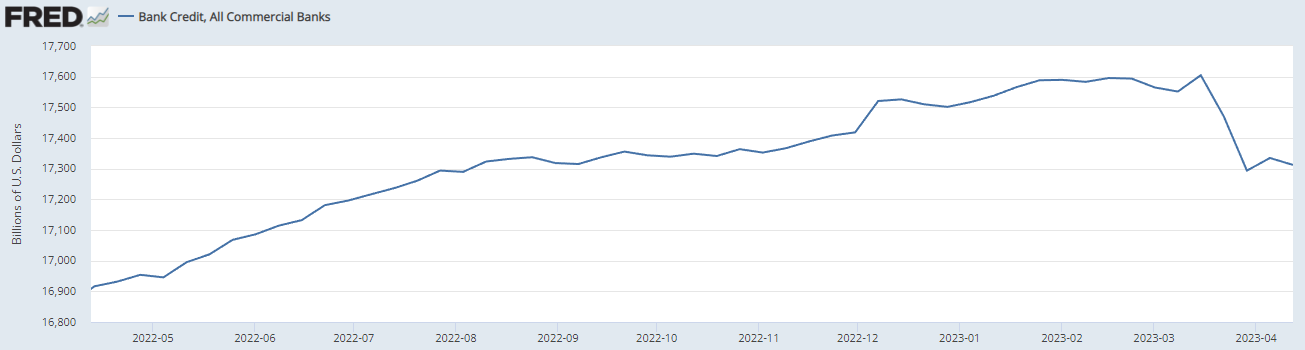
Big deal, right?! It is still way up over the past year! How often does total bank credit contract, anyway? Here are the two worst US recessionary periods post-WWII:
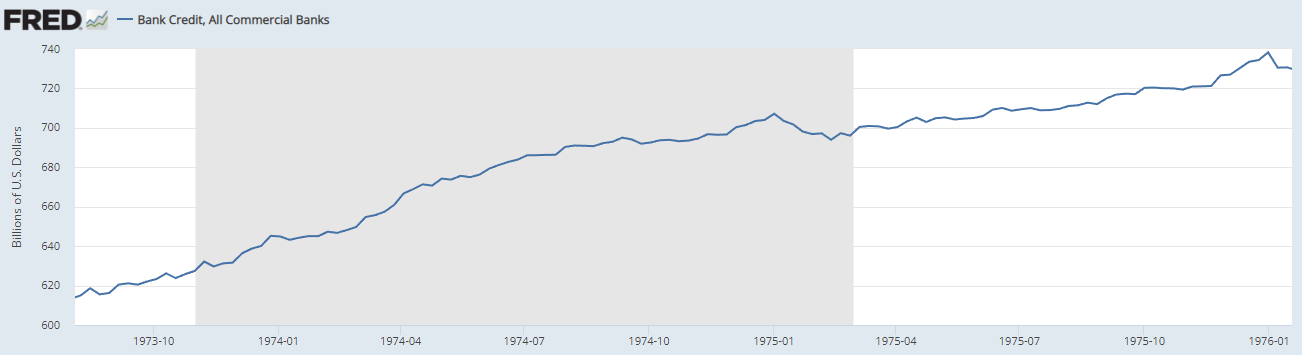
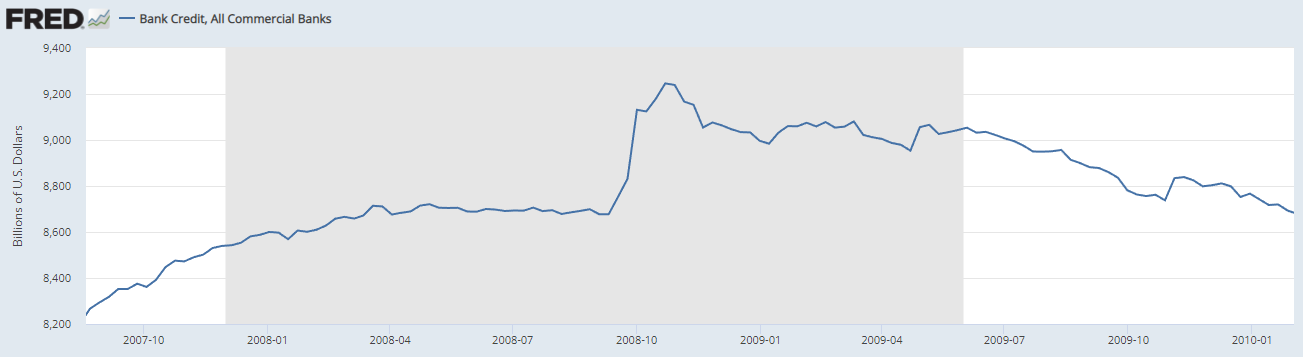
We can see from the 1973-1975 recession that credit continued to expand until the very end of the recession, while things did not get interesting in 2008 until the Lehman bankruptcy.
Shortly after the emergence of the Silicon Valley Bank crisis emerged, I expressed my view in various forums that the ‘bank run’ aspect would end up being a distraction from the biggest development and related risks - tightening credit.
Here is a graph from a Circle of Trust member, Lacy Hunt, from his most recent quarterly missive:
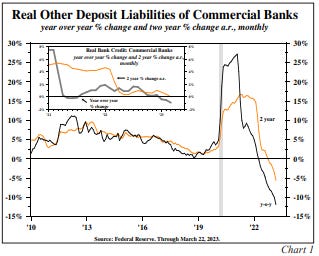
Hunt has written quite a bit about ODL (other deposit liabilities) as it relates to it being the most impactful monetary aggregate reported (part of M2). We can see the direction it has been trending, the severity of the move, and how bank credit has followed. Hunt had forecasted that the Fed’s various policies to tighten would reach an important inflection point in March 2023. Perhaps the emergence of the bank crisis and subsequent tightening in commercial bank credit is a coincidence?
The only other time since the creation of the Fed in 1913 that monetary aggregates declined at a rate comparable to the recent one was during the beginning of the Great Depression.
So let’s review once again for production, income, and sales:
Manufacturing is in recession and industrial production (not shown) has likely joined
Consumer spending has been supported by pandemic-era savings that are showing signs of exhausting, with credit filling the hole created by inflation
Credit availability is now tightening for consumers and businesses
Real expenditures (sales) peaked in January 2023
What about jobs? The unemployment rate remains at/near record lows for the US, but how are metrics that have historically been leading indicators for the jobs market doing?

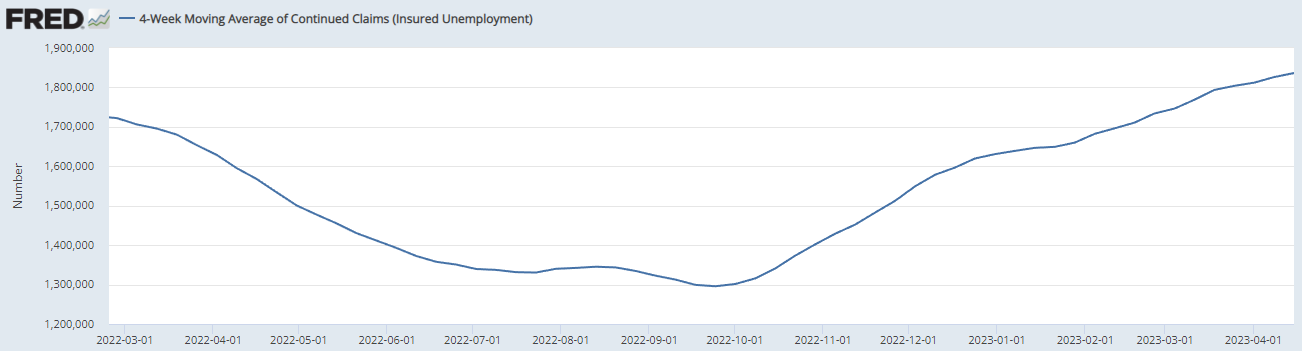
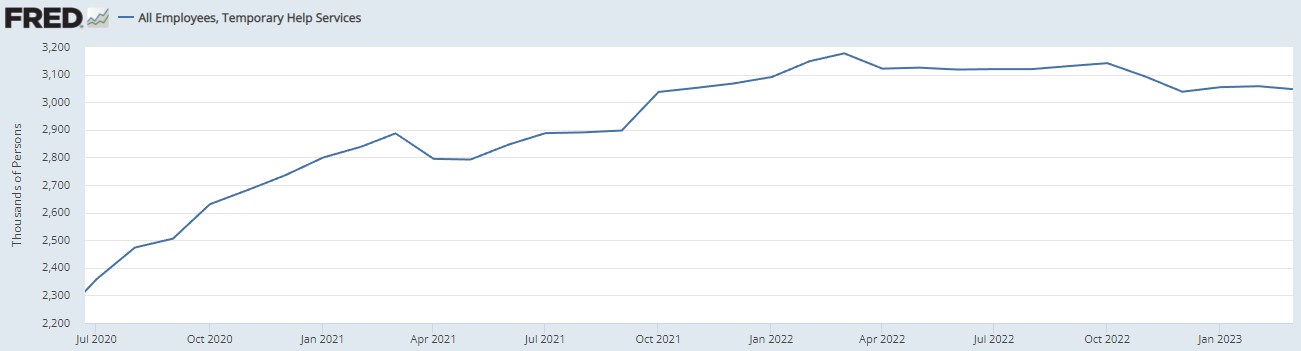
Those are initial and continuous jobless claims, followed by the number of temporary help workers being used. We can see that all three have shifted directionally in recent months.
Notice that I have not mentioned leading indicators up to this point - nearly everything here is historical or current/recent. Leading indicators remain pointing sharply downward, with efficacy looking ahead around three to four quarters.
It is vital to understand how we view the idea of recession here at Kayfabe Capital Tower. It is not some statistical measure such as two consecutive quarters of negative GDP. Rather, a recession is conceptual. It is when a feedback loop emerges between the “legs” - income, sales, production, and employment. The specifics of how these interact with one another as that reflexivity is triggered is different every cycle - kinda like a sandpile:
This cycle has been complicated by the pandemic era and events surrounding Russia’s invasion of Ukraine, with many complicated knock-on effects from both- inflation crisis, shifting consumer behavior, etc.
It appears to me that an overwhelming majority of investors and policymakers, including the Federal Reserve, are in various states of confusion about what is transpiring. This is manifesting in markets doing all sorts of interesting things and seemingly sending mixed signals.
I believe the point of recessionary reflexivity has already occurred - probably somewhere between November and February. It is being led by what is rapidly becoming a debacle in manufacturing and the goods economy, with inventory levels still elevated and many more Mack Attacks to occur. The US consumer is in the process of hitting a wall, and job losses are likely to increase substantially in the coming months. The Fed continues tightening, bank credit is contracting, and monetary aggregates are declining at a significant rate.
Pointing to relative stability in the big banks at present is analogous to pointing to the seeming resilience of manufacturing in the spring of 2008. The general confusion and developments like the mania unfolding in equity options continue to offer time for investors to act in order to be ‘safe.'
Like natural disasters, recessions come in varying forms, shapes, and sizes. The warning signs for this recession are now at a ‘clear and present danger’ magnitude, where denying its existence or gambling on when others will ‘turn around’ to see it, maybe very dangerous….and too late.

Great post!
Another excellent piece.
I have been surprised that the labor market has held up. I work at a warehouse for a large retailer and they have gotten rid of a lot of people through attrition. Now, they have cut our hours from 40 to 32. My wife works at a grocery store and her hours are also going to get cut as they implement self checkout. I suspect a lot of companies are hoping for a pickup in the second half that won’t materialize and the layoffs will really start to accelerate along with the defaults on credit cards.