

Limp Liquidity

Since the Global Financial Crisis, investors and traders have done it all for the nook….liquidity. There are various definitions of the term, and monitoring central bank balance sheets and the US Treasury’s General Account (TGA) have become all the rage over the past 13+ years. Who can blame Pavlov’s Investors for responding to their conditioning like the advanced monkeys we all are?
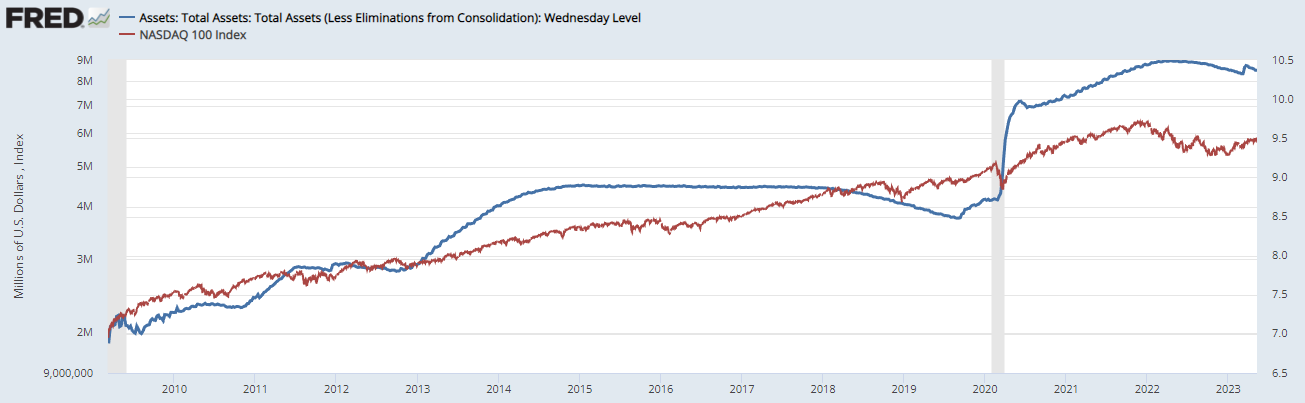
Since the lows in March 2009, the US stock market certainly seems to enjoy itself when the Federal Reserve expands its balance sheet, with the big moves coming via Quantitative Easing (QE). Central bank balance sheets and related bank reserves are one element many reference as ‘liquidity.’ In the good ole days, central banks cut interest rates and lent via the discount window as their primary tools to try and offer liquidity to the financial system. Cutting interest rates has been a time-honored tradition….eventually….for the Federal Reserve since 1921.
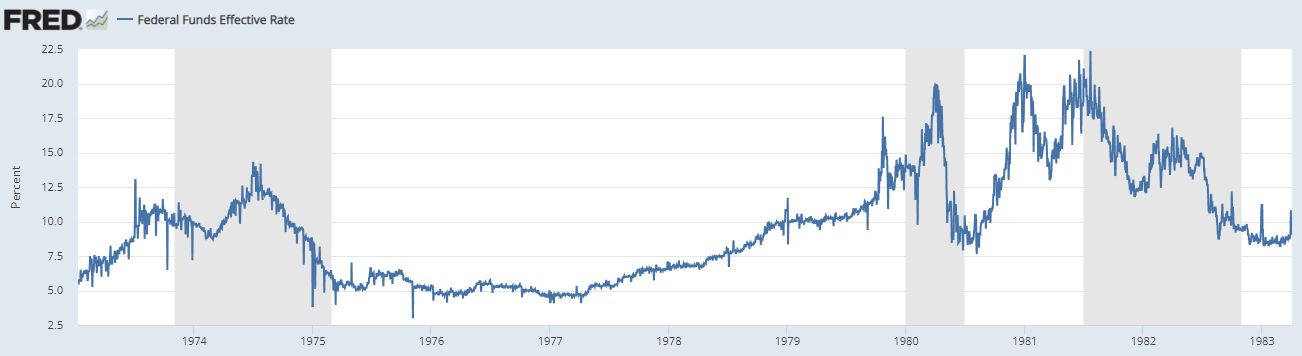
The high inflation cycles of 1973-1975 and 1980 are relative outliers, with rates persisting higher well into those recessions, but the interest rate cuts did eventually arrive.
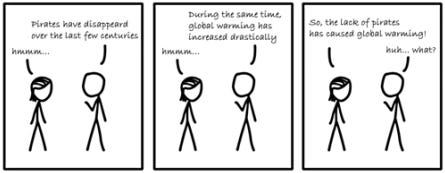
But does the correlation between QE and the stock market mean there is causation?
I remember a similar dynamic referenced in the post-GFC bull market in precious metals:

That graph runs through the 2011 debt ceiling crisis and up until just prior to when then-Fed Chairman Ben Bernanke announced ‘QE Eternity’ at the September 2012 Fed meeting and press conference.
The announcement is popularly referred to as QE 3, but I have called it QE Eternity-it was when Bernanke shifted to using the Fed’s balance sheet as the primary policy tool instead of interest rates. This launched the ZIRP era and is the antecedent of policy madness from which the current banking crisis is blossoming.
I remember that period vividly, as I was among the horribly mistaken people who equated QE with ‘money printing’ and believed there was a causation underlying the correlation shown in the graph above. Doh!

Despite QE 3 persisting through 2014, precious metals and many other commodities began what would be a long period of lower prices and relative stagnation. In fact, gold remains nearly 20% below its September 2011 peak in inflation-adjusted terms, even using what I call the official phoney baloney inflation rate.

There has been an echo round of this correlation since the onset of the pandemic and the explosion in the Fed’s balance sheet in the spring of 2020, and there was a relatively limited amount of actual money printing by the Fed during that period, as they extended their balance sheet directly to non-bank entities. However, the bulk of the balance sheet expansion was our old friend, QE.
Within economics nerd circles, QE remains relatively controversial with the efficacy of the policy still debated. Indeed, even among its advocates, it is generally considered an inferior policy tool to stimulate the economy and provide liquidity relative to interest rate cuts.
This is where the analytical rubber hits the road. If interest rate cuts are a superior form of stimulus and liquidity, and interest rate cuts have not historically been successful at offsetting the implications of business cycle contractions on risk assets, then why would QE have that magic power?

Cutting rates did not seem to have any magic powers in the 2000-2003 or 2007-2009 recessionary bear markets. If we zoom in on the GFC period of Fed balance sheet expansion, how tight was the correlation between it and the stock market?
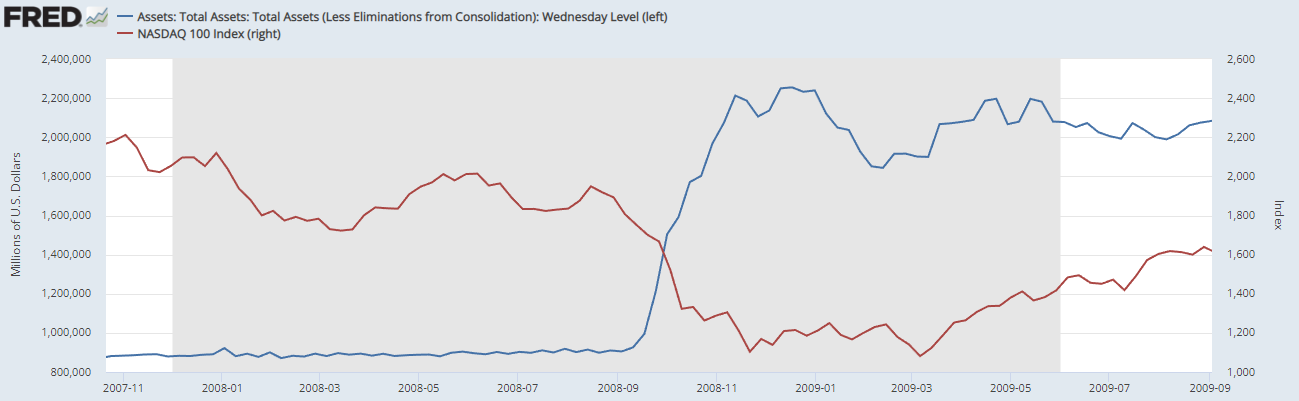
With the ultimate market low in March 2009, the correlation kicked in about that time, with the parabolic move in the balance sheet beginning with the collapse of Lehman Brothers.
But what else was occurring in early 2009? Firstly, leading economic indicators bottomed in January 2009. Secondly, FASB capitulated to pressure in mid-March and began the process of changing the rules around marking to market for US banks.
Liquidity does not replace equity. Equity is destroyed during typical business cycle contractions. In fact, liquidity going up is a normal signal of policymakers responding to the destruction of equity taking place as recessions unfold.
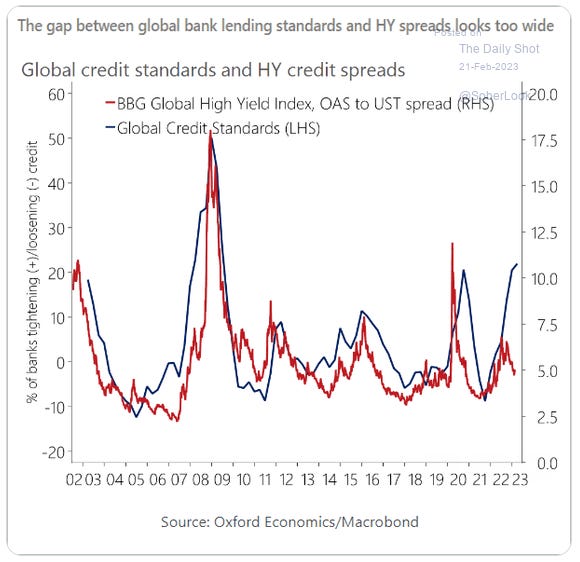
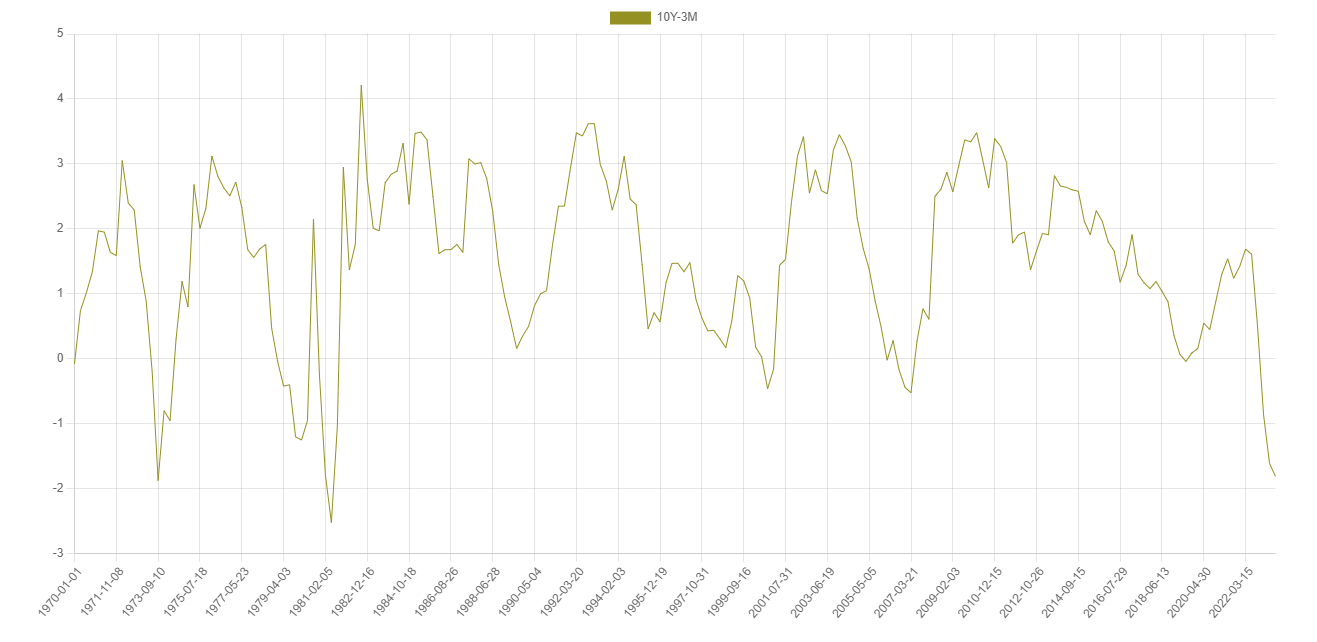
The credit cycle is just beginning to turn as lending standards tighten and financial leverage is impaired by the inverted US yield curve:
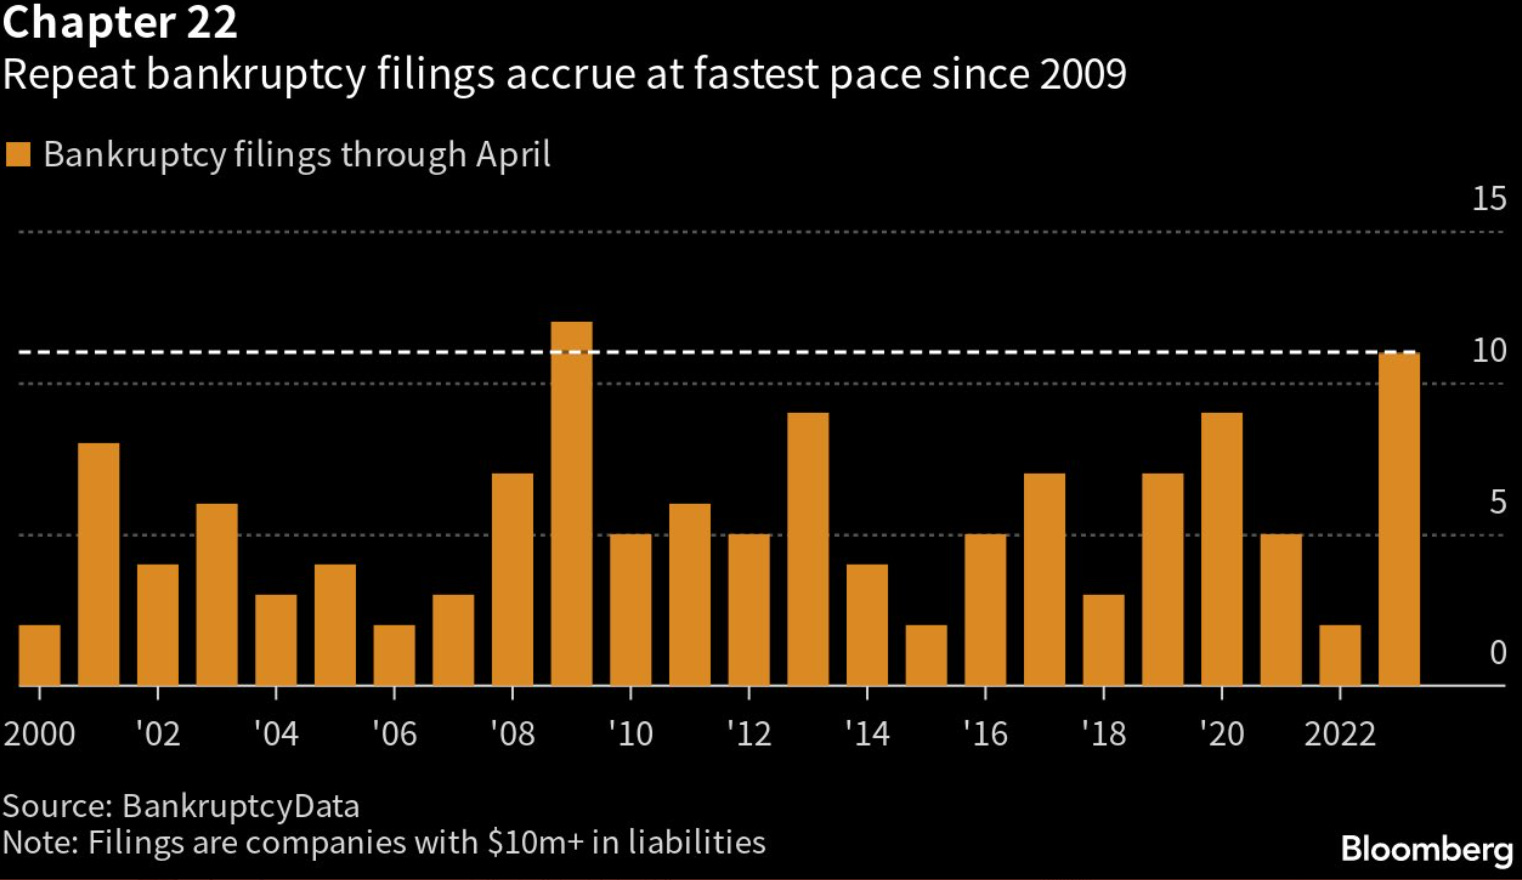
Defaults and bankruptcies are just getting started this cycle, with some warnings signs already flashing:
Of course the Fed and other central banks will eventually ‘pivot’ and open the floodgates of liquidity! They now have plenty of room to cut interest rates, and reverting back to QE would not be surprising.
However, they are likely to be doing so within the context of a severe global recession with equity being destroyed left and right - much of it outside the confines of large bank balance sheets.
Private equity, venture capital, and other non-bank ‘shadow banks’ have taken market share since the GFC, and dwarf the current and potential issues with regulated US regional banks. In fact, non-bank financial intermediaries likely control global financial assets worth over $200 trillion.
I speak from experience that mistaking correlation for causation can be very costly. Liquidity does not equal solvency, and it is the significant increase in insolvencies caused by recession that normally result in the former going much higher.
I suggest investors focus on that real causational relationship instead of the ‘kayfabe’ statistical correlation one.