

Technical Terror

Over the past 25 years, I have explored quite a wide range of analytical tools and frameworks when it comes to financial markets. The following are some examples of the methodologies and research services I have either used, explored, and/or consumed over the years:
Classical charting
Elliott Wave
Point and figure
Ned Davis Research
Lowery’s technical research
Demark indicators
Investech (Jim Stack’s framework - he remains excellent)
Belkin Report
High Tech Strategist
Perhaps you may notice that none of them are traditional sell-side Wall Street research, which I have generally found to be severely lacking over the years. One of the reasons I ended up coming across complex adaptive systems-related analytical frameworks was my continued pursuit to find a process that worked for me.
Since the pandemic-era lockdowns and the explosion in retail trading within the stock market, various forms of technical analysis have become all the rage. Whether classical chart patterns, moving averages, breadth, volume, or trendlines, there is a huge universe of tools and schools of thought available to explore. One common argument I read and hear about relative to the huge market rally since the October 2022 lows have been how the ‘market’ has broken out and stopped making lower highs. This has certainly been the case for the S&P 500 and Nasdaq 100 Indexes:
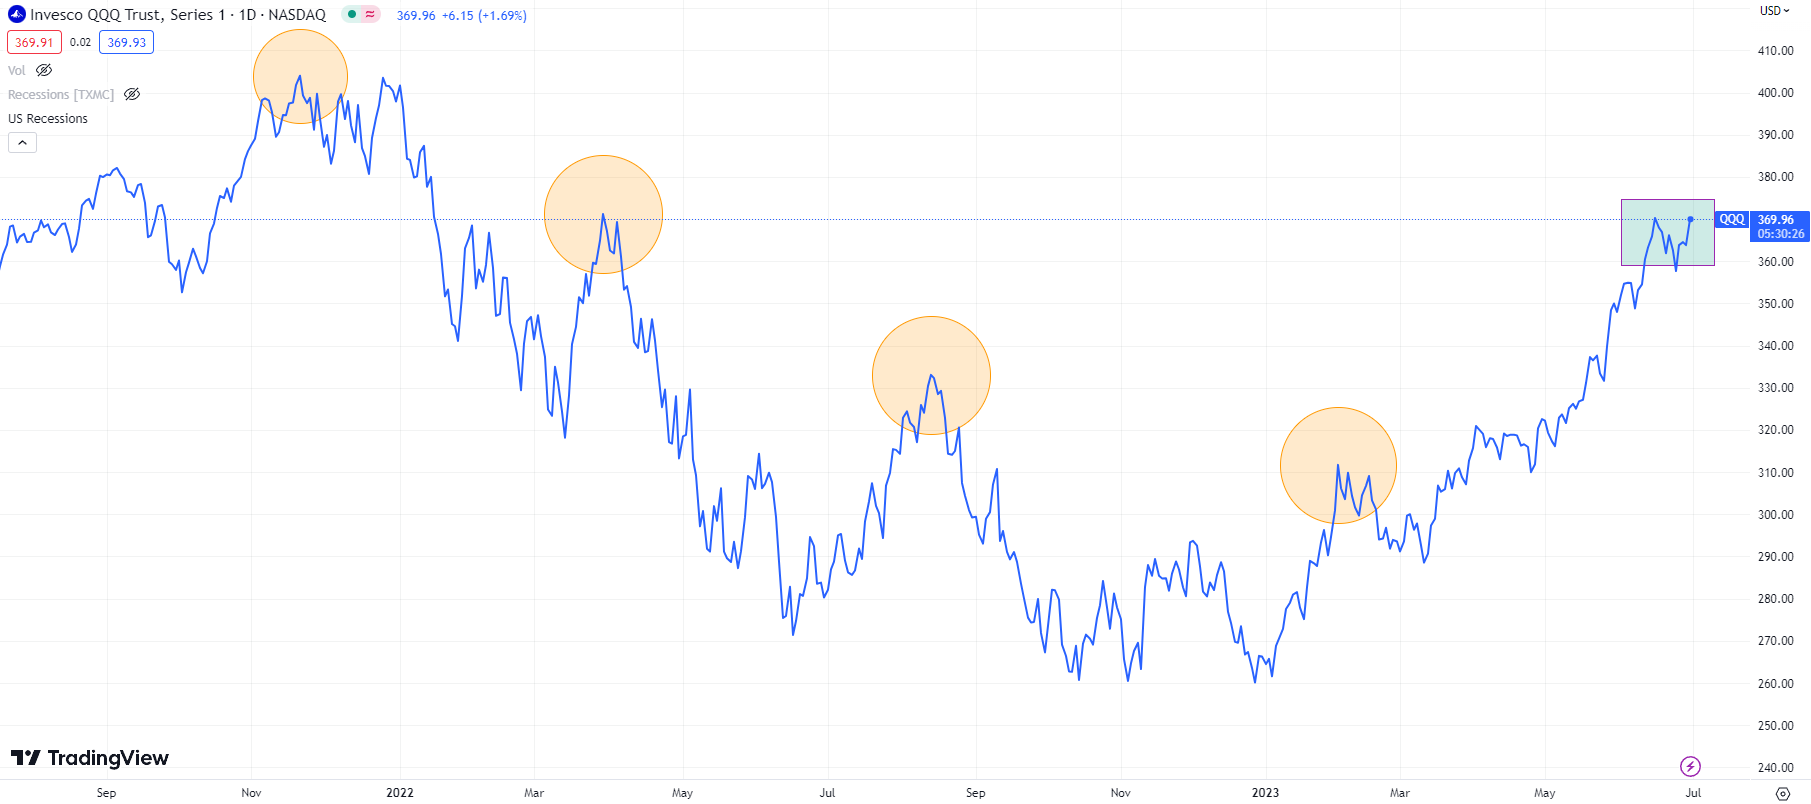
This is a daily chart of the Nasdaq 100 Index ETF (QQQ), where I have drawn circles around the prior cycle highs it had made, including the peak in late 2021. We can see from the current price range within the rectangle, that the index has returned to the area of the late March 2022 rally peak, and has most definitely broken out above what had been the two prior lower peaks in August 2022 and February 2022.
It’s a new bull market!!!
The chart for the S&P 500 Index, as represented here by the major ETF (SPY), has not quite returned to its August 2022 peak, but certainly left the prior two in the dust:

An interesting story emerges though when ‘looking under the surface’ of the US stock market. The major indexes mentioned are market capitalization weighted, which is to say the larger the company the bigger its impact on the price of the index. In fact, Apple and Microsoft now have set a record for the largest ever weight for the biggest two stocks in the S&P 500, at over 15%, while they comprise over 25% of the Nasdaq 100 Index!
There are ETF’s that track these two indexes on an equal-weighted basis - think of it as the communism of index construction:


We can see that the equal-weighted averages have lagged quite a bit and remain below those August 2022 peaks. How about as we move down the market capitalization spectrum to midcaps, small caps, and even microcap index ETF’s?
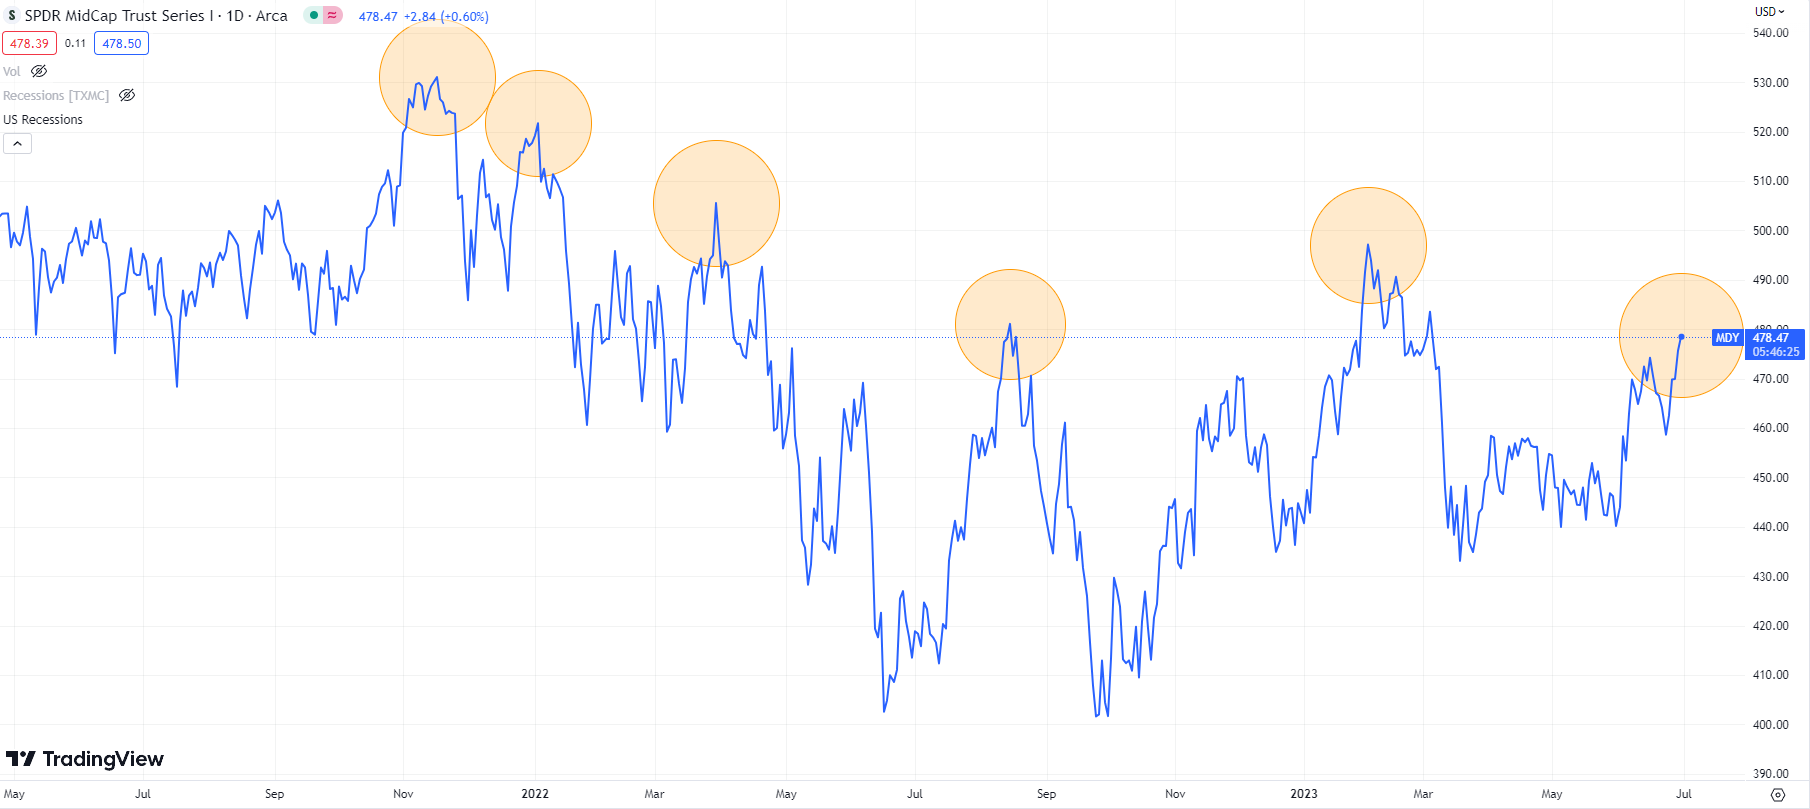
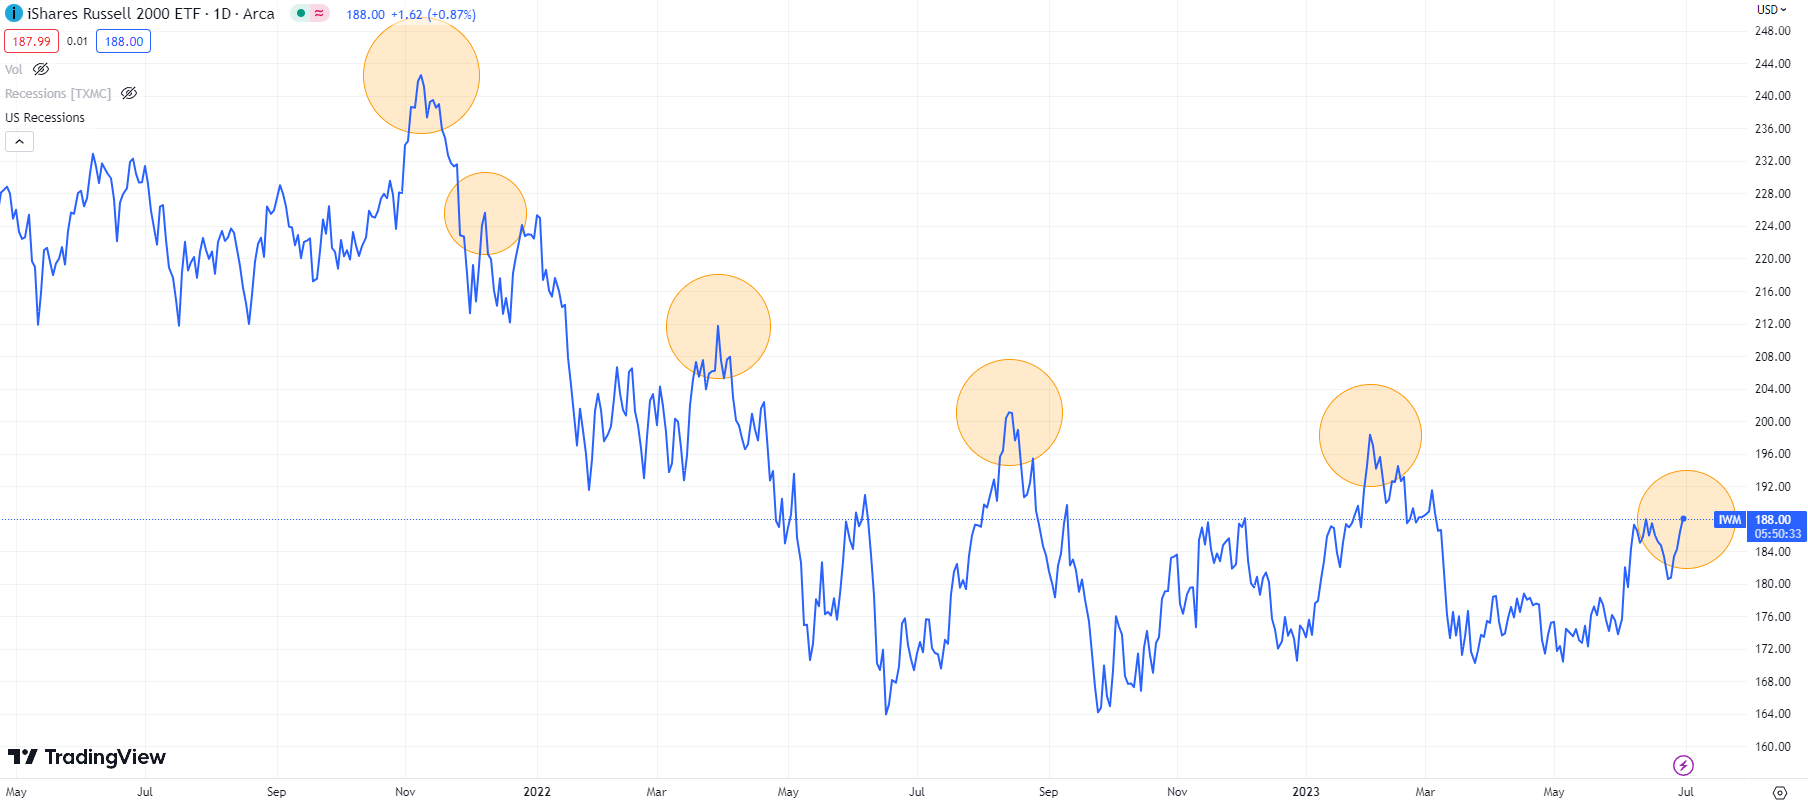

Despite a pretty wild swing in sentiment back towards the bulls, and retail investor flows exploding again into the US stock market generally, none of those indexes have eclipsed their February 2023 peaks, let alone August 2022.
If we look back at these indexes during prior recessionary bear markets, some similarities relative to divergences were evident.

Remember the technology and telecom mania of the late 1990s? Here was the Russell 2000 Smallcap Index ETF (IWM) during that period, with two separate dastardly trips back to prior peaks, that could have easily been mistaken as NEW BULL MARKET!!!
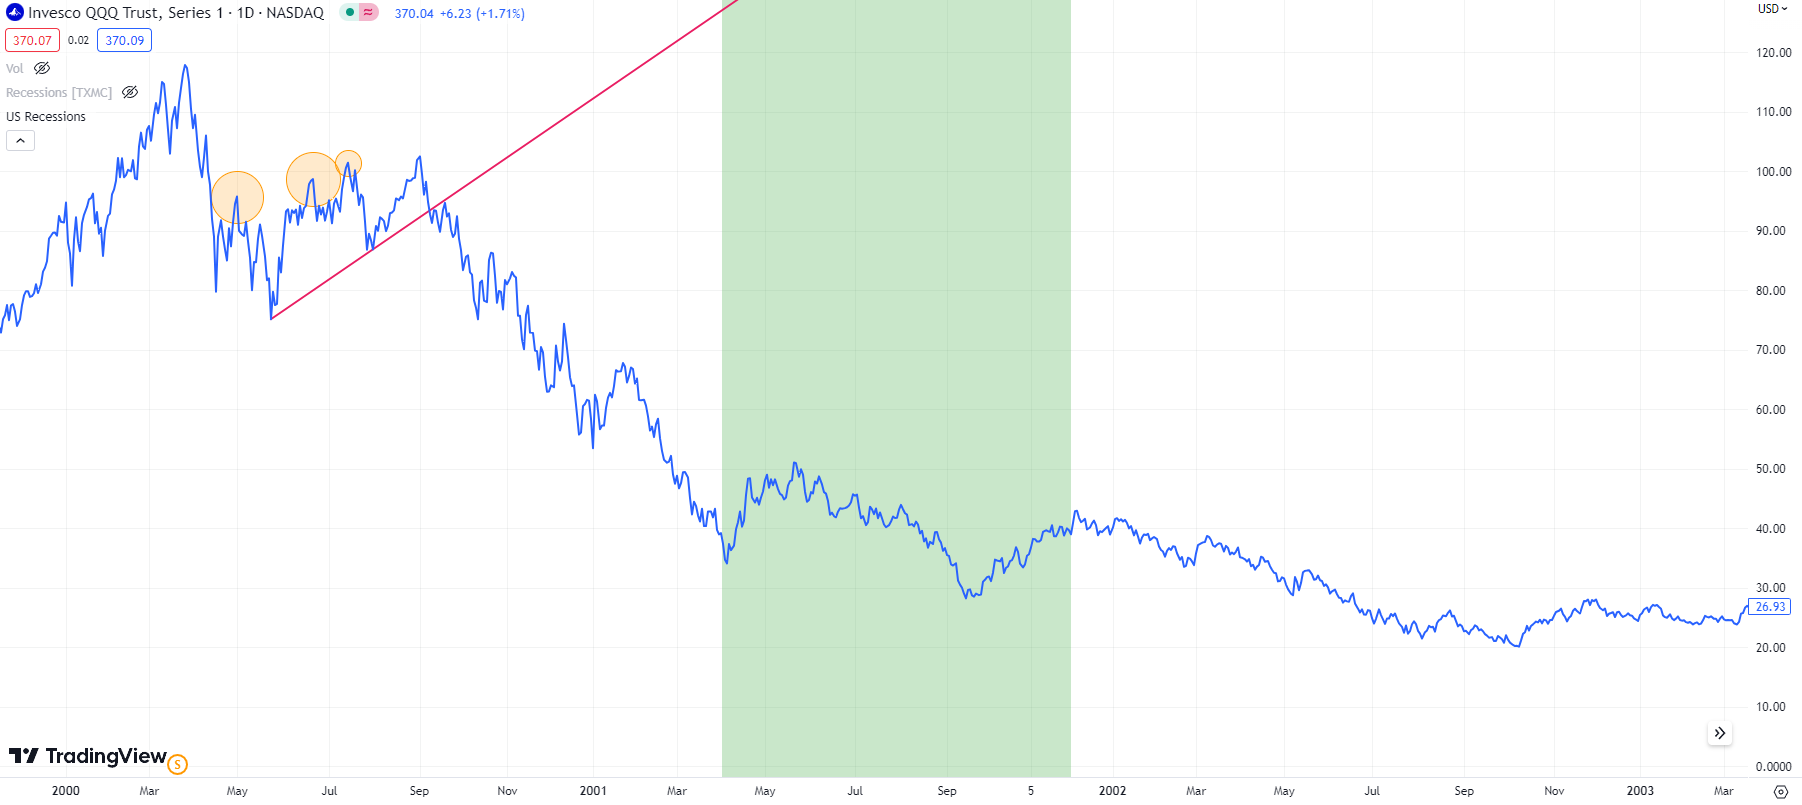
Even the Nasdaq 100 ETF threw in some confusing higher highs during its process of rolling over into the meat of its massive cyclical decline from March 2000 through October 2002.

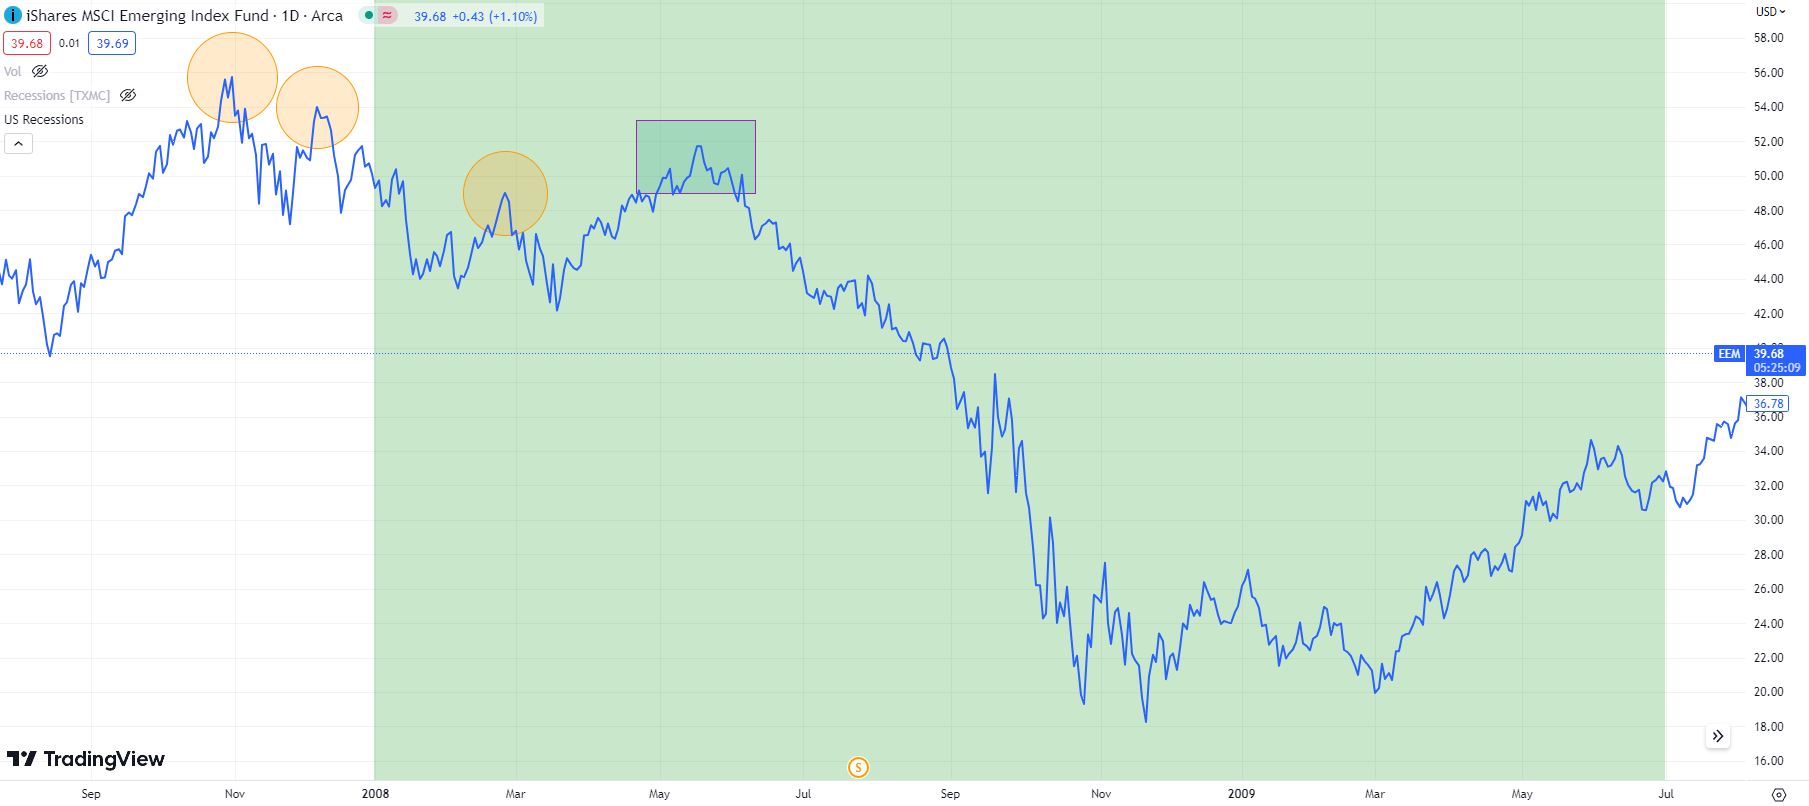
These two charts are of IWM and the MSCI Emerging Markets Index ETF (EEM) for the 2007-2009 recessionary bear market. Despite what would become the most severe post-WWII recession and bear market until the present, those indexes ‘broke out’ and were not very far from what had been their cycle peaks many months into that recession.
This is the evil trick that recessionary bear markets play on us, as these divergences leave ample room for narratives to form and fuel optimism, just as the recession is poised to accelerate and the ‘sandpile’ cascade spreads violently. In 2008, the problems in the US financial system were allegedly ‘contained’ and emerging markets had supposedly ‘decoupled.’ In 2001, talk of how resilient the stock market had been anytime the Federal Reserve had cut interest rates several times was a rampant bullish narrative.
Currently, I see all sorts of narratives ranging from excess consumer savings, to a tight labor market, and artificial intelligence. In reality, this has been an extended recessionary bear market rally, with some very specific elements that have made it quite a long one.
Mike Green has researched and written extensively as to the emerging dominance within developed stock markets, and particularly in the US, from zombie-like passive investment flows from retirement plans. Basically, people’s 401k contributions are invested into passive index funds in a robotic way regardless of fundamentals. In addition, because the indexes are cap-weighted, more money is allocated to the bigger stocks, and rinse and repeat - creating a sort of self-reinforcing momentum.
This has also created huge pressure amongst so-called active investment managers, who have had to try and compete with the passive indexes that have been riding the momentum to a dominant performance. This has created another level of FOMO (fear of missing out) as active managers chase momentum names or face the career risk of underperforming a runaway freight train.
Ah, but this is not the end of the story! As I began writing about last September, the US stock market has also enjoyed a burgeoning mania in options trading and involvement since the pandemic-era lockdowns, with the mania going into overdrive with major indexes getting daily expiries listed - now known as 0DTE (zero days to expiry).
The result has been an orgy of daily options trading that has the market tail wagging the dog. Here are a couple of charts from Tier 1 Alpha’s Twitter account, which is a firm Mike Green is involved with that publishes research on various topics such as options and volatility. Mike’s recent interview with Hedgeye was very informative on these topics:
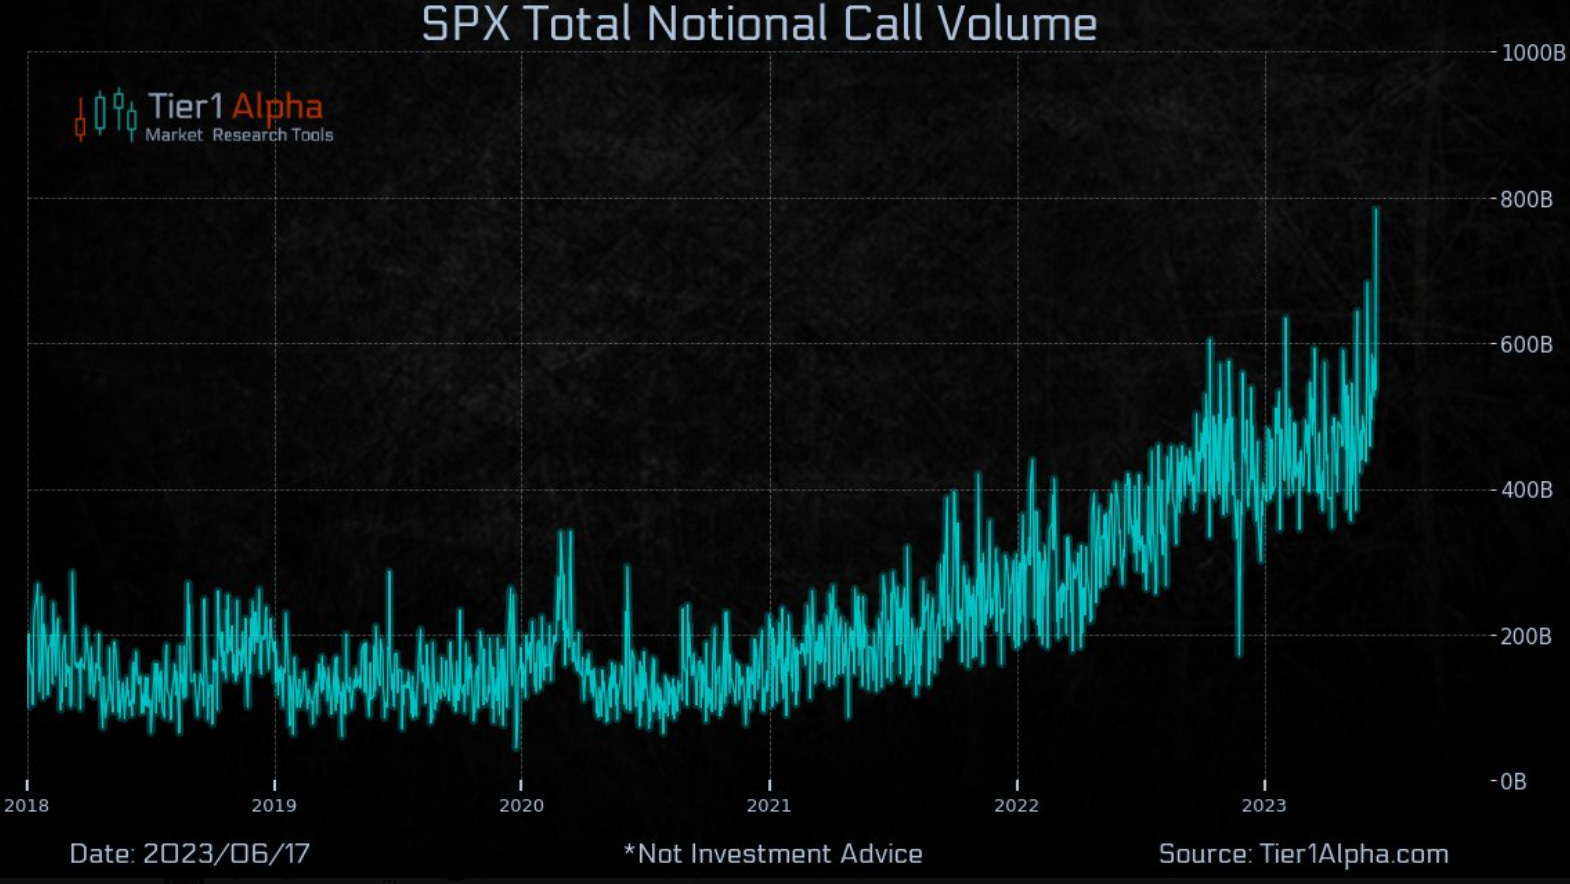
The first shows the explosion in SPX call option notional value being traded over the past two years, with a recent parabolic move towards a quadrupling to almost $800 billion, and up by about a factor of eight since pre-pandemic.
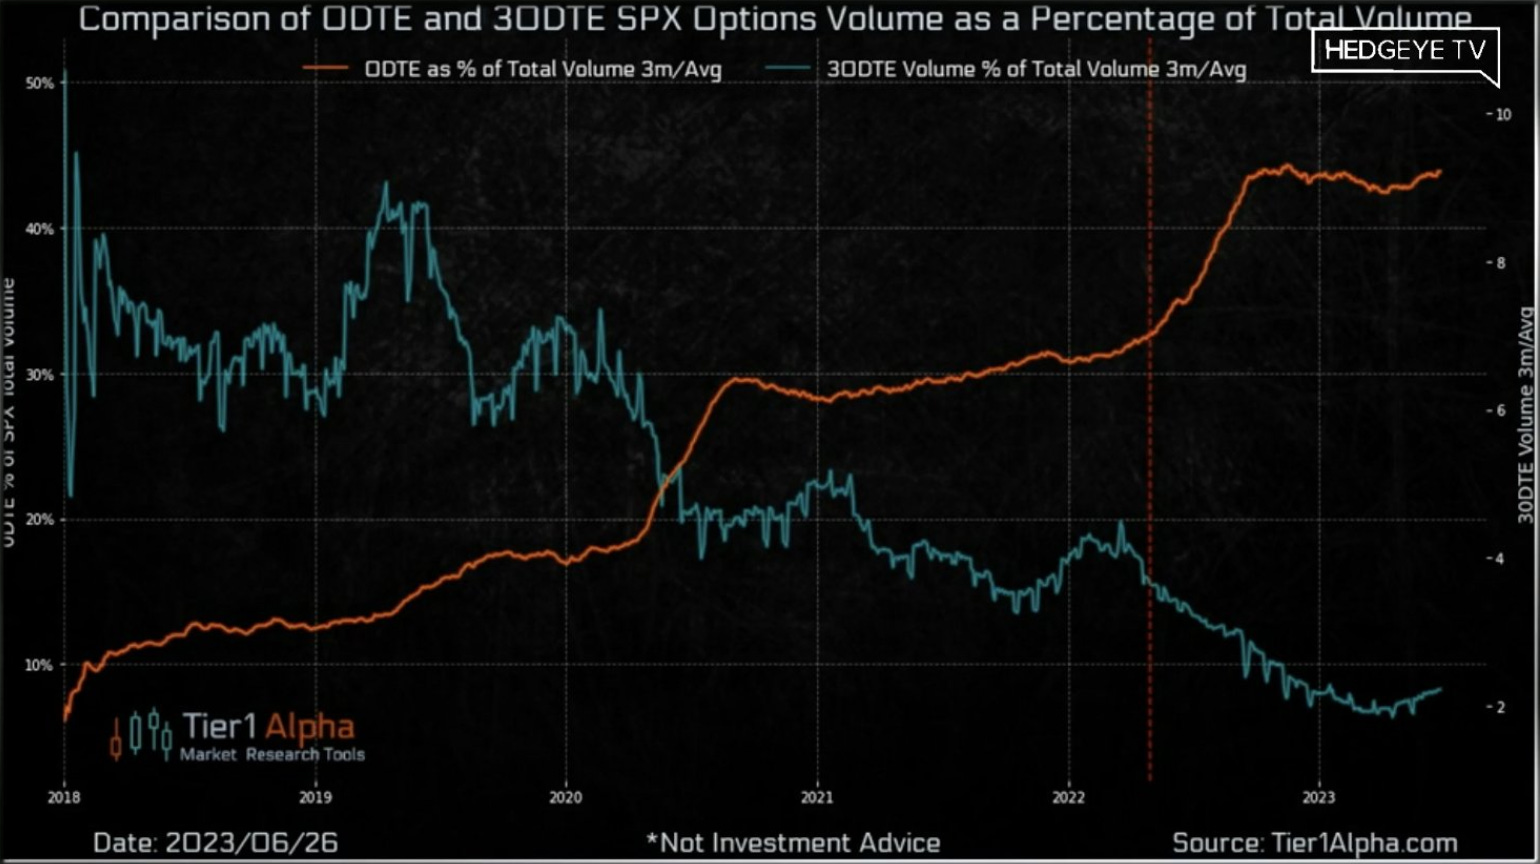
The second shows the trend towards options that expire the same day - i.e. the 0DTE and relative to options that expire in 30 days. Not only has options trading exploded, but it is now frighteningly concentrated in the most supercharged short-term derivative contracts available.
What does any of this have to do with a potential recession, earnings, interest rates, Federal Reserve policy, etc? Very little, in my opinion. There are many people with far greater expertise on these issues, but from a complex adaptive systems perspective, I see these emergent system dynamics as EXTREMELY unstable.
The confluence of these factors, along with the normal Fog of Cycles, has conspired to create an extremely dangerous backdrop for investors, in my opinion. It would be easy to ‘buy into’ any of the various narratives about a soft landing given how markets are behaving.
While the details are pretty extraordinary this cycle, the process of dastardly trickery is all a normal part of recessionary bear market kayfabe. Just be sure to keep straight what is real and what is fake.
Thank you. I have been reading what you write for I think a little under a year. There is tremendous value in your words. Just my opinion of course.