

A Blue Moon Resurfacing
A Blue Moon Resurfacing
Writing once in a while...

The prior post here at The Worked Shoot was titled Seminal Singularity, in which I revisited why my analytical framework suggested that the time for a potential, and extremely important, phase transition within the cycle may be acute. It is impossible to understand this point of view without revisiting Schrodinger’s Bak from July 2022, when I laid out more about the integration of self-organizing criticality-derived concepts applied within the Kayfabe Capital analytical framework. That broader framework was covered within the first post on this Substack in November 2021.
For anyone interesting in getting more out of this post, then revisiting those pieces is worthwhile.
As I wrote in the Seminal Singularity post, the underlying thesis of my cycle-timeframe has been a Frankenstein of 1974 with 1930, with the Singularity signifying the baton being passed from one regime to the next - i.e. from 1974 to 1930.
The 1974 regime was one of a high inflation shock with confusing developments in official economic data that left many at the time….well…confused. Here is a section from a New York Times article from July 1974 - remember, the NBER would eventually date what turned out to be a severe US recession to have started in late 1973:
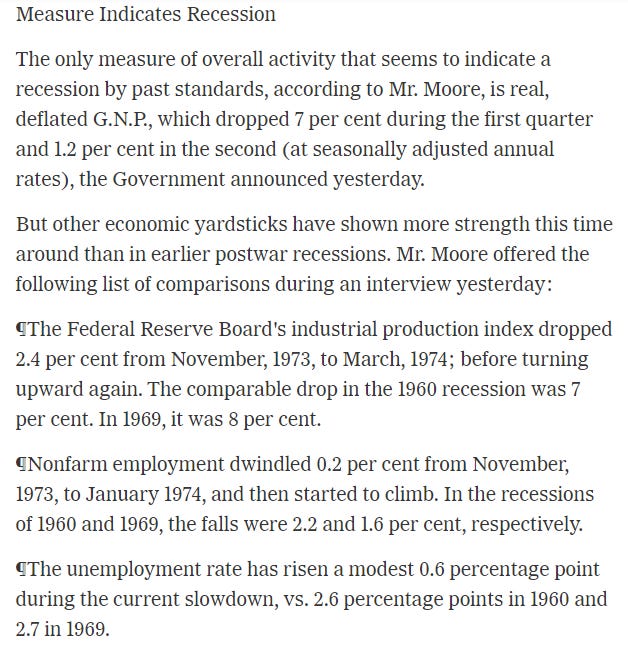
Further along in the article:

The “Mr. Moore” was Geoffrey Moore, the founder of Economic Cycle Research Institute (ECRI), and a founding father of business and inflation cycle leading indicators. ECRI is one of the the members of the Kayfabe Circle of Trust, as a reminder.
One of the great “mysteries” this cycle has been how negative leading indicators have been for the US economy, yet measures such as GDP have remained resilient, or even significantly positive, as reported for Q3 2023 to date. Here is the latest LEI graphic from the Conference Board:

ECRI has gone on to build off that earlier LEI-driven work, so the Conference Board’s version is closer to using dial up for internet vs broadband, but it is publicly available so it is the one most often referenced.
The gap which has opened up has driven many to doubt the efficacy of LEI’s, but through the lens of the broader Kayfabe framework, this cycle’s events are easily explained. As laid in Schrodinger’s Bak, the details of each cycle are unknowable in advance, so I am not going to pretend to have anticipated all details, and this Substack has not been about making “predictions.” Rather, this has been about offering an alternative variant perception with the hopes of helping people better understand the world around us as it unfolds.
Here are the elements disclosed as being part of the LEI shown above:
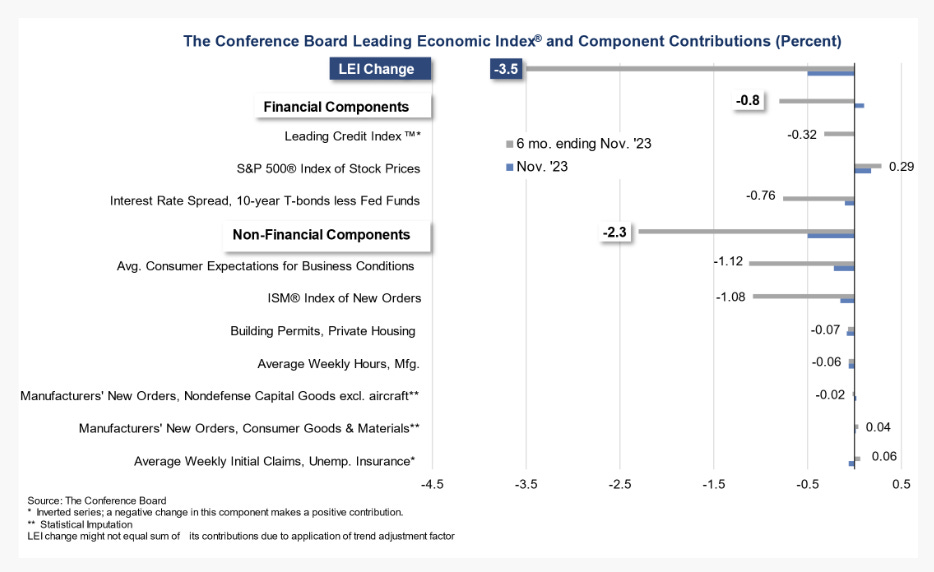
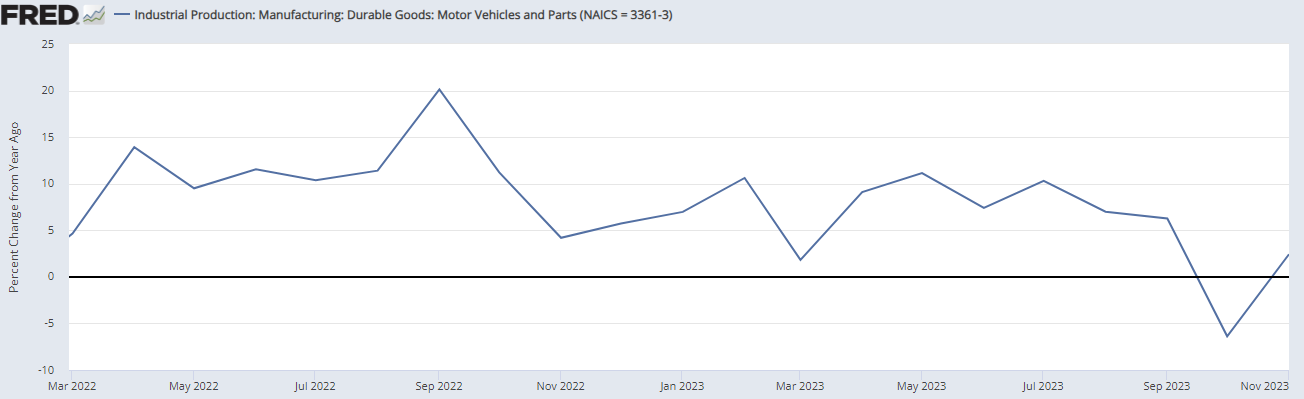
We can see that the non-financial components are tilted towards what are considered to be the more cyclical parts of the economy - such as manufacturing and housing. Despite what has been a significant rebuild in automotive inventories in 2023, here is the broad industrial production and the manufacturing component:

We can see that manufacturing has contracted nominally year over year in 10 of the last 12 months reported, the broader industrial production index in 5 months, and both having rates of change well below the reported broader consumer price level for the entire period. The ‘leads’ for those sectors of the economy have been pretty prescient!
Remember - that took place with the auto-related industry ‘booming’ on a relative basis with an interlude surrounding the period of striking workers last autumn:
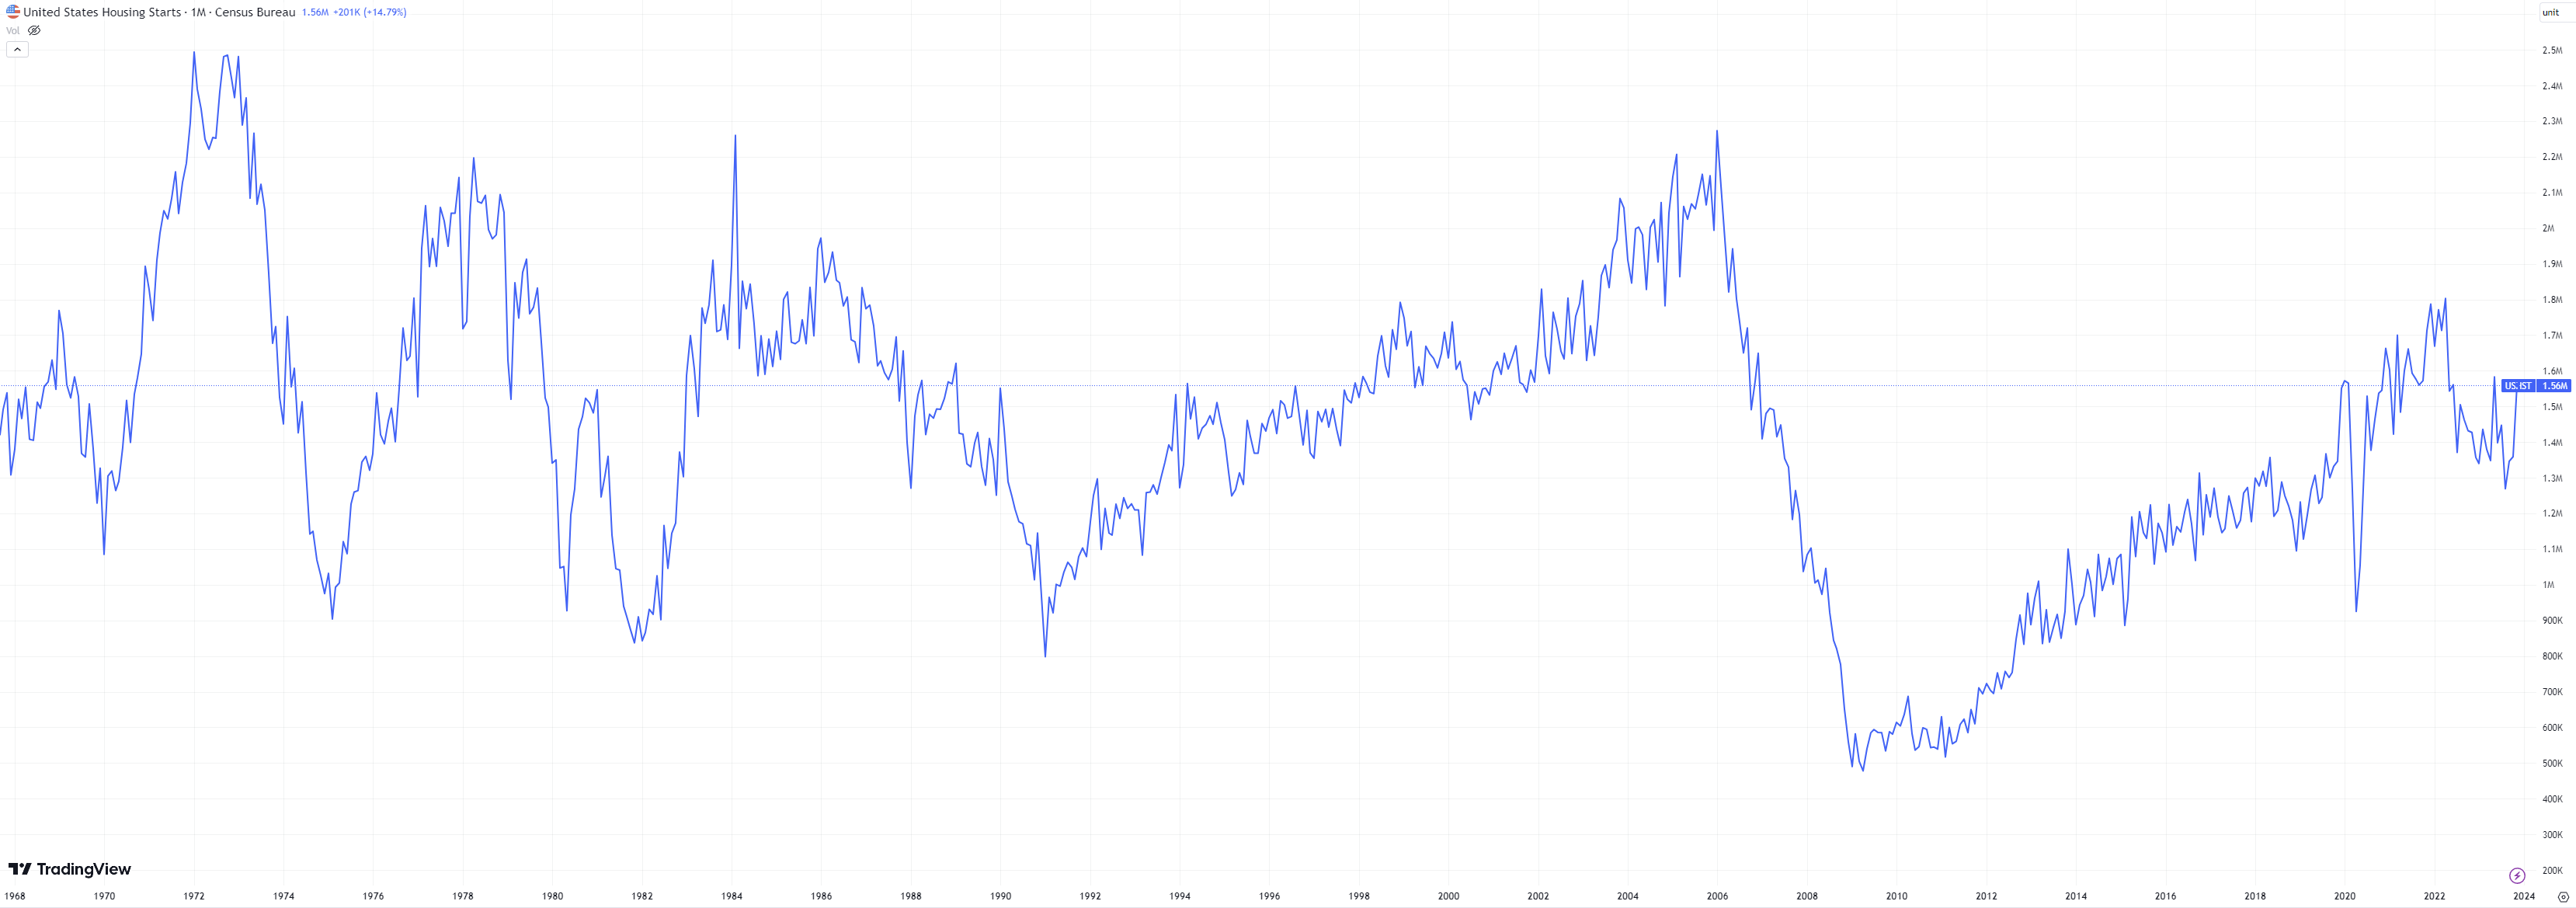
Housing has also been EXTREMELY nuanced this cycle, which is important because it is an industry that many place at or near the top of the ‘leading indicator’ bucket. Given the Kayfabe embrace of self-organizing criticality, I try not to impose ‘typical’ thinking into expectations.
The unusual explosion higher in mortgage rates over 2022 and into 2023 resulted in a collapse in existing home sale activity:

The run rate dropped by about 2.75 million homes back close to the depths of the GFC-period lows. At the same time, new home starts fell as well but the stock prices of the big public builders have been ON FIRE!!! How could housing be doing poorly if the likes of Lennar, Pulte, and Toll Brothers are doings so well?

“Housing” must be doing great! The big public builders have huge strategic advantages versus what remains a relatively fragmented industry across the US, with the ability to offer all sorts of buying incentives to compete against smaller builders. For example, as mortgage rates exploded higher to 8%, their size enabled the ability to “buy down” mortgage rates, offer teaser rates, etc. Johnny Local builder does not have that flexibility, and hence the big public builders have benefited from the very specific nature of this housing downturn.
Remember - every cycle is different and hidden interdependencies are a feature and not a bug. Obviously, it would be great to figure all this stuff out in advance in order to profit from emerging trends, but that is a completely separate conversation. This post is about trying to explain what has been occurring and what it may mean going forward.
So far we have the housing and manufacturing sectors acting like they are in a ‘recession’ of sorts, but where in the hell have the job losses been? Note that one of the nonfinancial components of the LEI above is initial jobless claims:
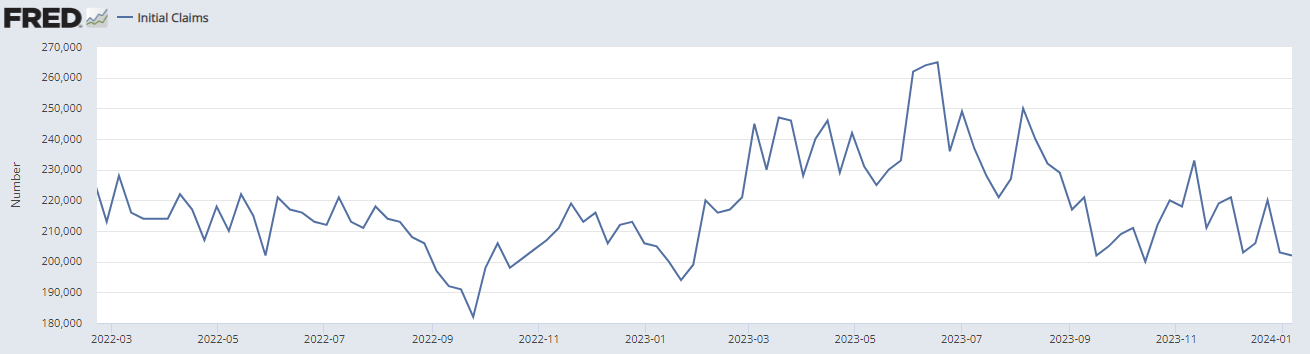
The most recent report of seasonally adjusted initial claims was just 202,000, or not far off the EXTREMELY low level at the low of 184,000 in September 2022. To put those two figures into some context, the lowest level reached during the incredibly broad economic expansion of the late 1990’s boom was 259,000 initial claims in April 2000, printed just after the major stock market average peaked.
So how in the hell can we be or have a recession with seemingly “no one” losing their jobs?! As I have written before, a recession BY DEFINITION requires a contraction in the labor market, as the impacts of that contraction are fundamental in triggering the reflexivity that defines recession - i.e. lower incomes, sales, production, and labor feeding back upon one another to cause more in a spiral until the cycle exhausts.
Oh dear reader, the labor market is contracting…just kinda sorta in a weird way….see the housing market detail just above for how fun analyzing the idiosyncratic elements of this cycle are!

Historically, the hiring and firing of temporary workers have been a decent leading indicator of labor market cycles. The chart immediate above shows, similar to most charts over the pandemic period-forward, the huge swing in those jobs being laid off and then returning as lockdowns lifted. Temp workers have generally been getting laid off on a net basis since late 2022.

Here we see hours worked for workers in the manufacturing sector have been in contraction for the same period.
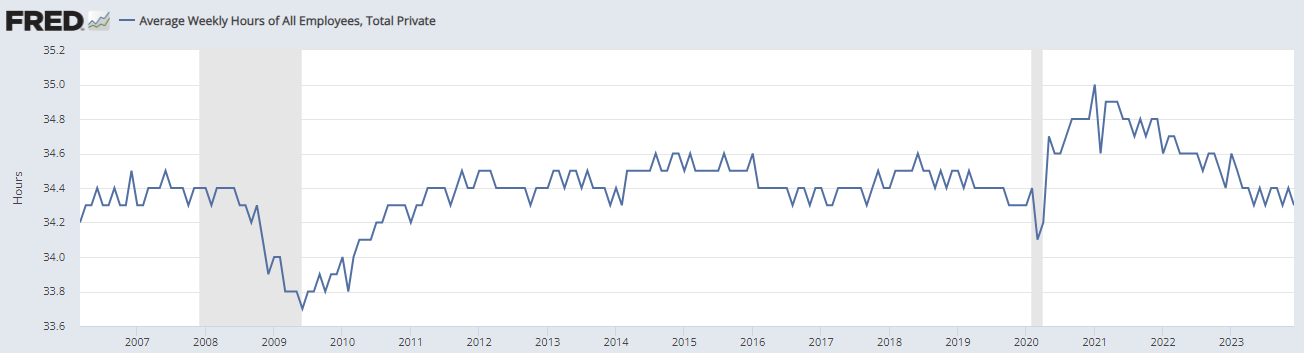
Here is average hours worked for all private employees, which has again been declining.
These are evidence of hours being cut and easily reduced labor costs such as temps being eliminated, but that could be evidence of just a slow down in growth rather than recession.

Given the cost of living crisis that has befallen many households over the past 3 years, with reasonable estimates of it being 25% plus for many, combined with many working class people living paycheck to paycheck, are unemployment benefits sufficient to keep people going?
Or perhaps, have developments such as hours being cut drove many to take on one or more part-time jobs while still working full-time, or even when laid off from full-time employment?
One of the important concepts borrowed from self-organizing criticality within the Kayfabe framework is that of renormalization within the context of a sandpile avalanche.
To date, and part of why I have been concerned about how dangerous this cycle is/will be, are what I’ll call Kayfabe stabilizers. The amount of pandemic era savings on consumer and corporate balance sheets, households and companies having termed out debt obligations when interest rates were very low, the effects of money illusion coming out of a high inflation environment, fiscal spending to build microchip plants into an industry riddled with cyclical excess capacity, etc. all contribute to the danger of misplaced hope and optimism of cyclical renormalization - i.e. the “Soft Landing” scenario.
That scenario would mean that areas like manufacturing and housing begin to turn back up and grow to help trigger a renewed growth path in the broader economy before their weakness and wider scale job losses generate the opposite.
If one were to visualize a dam or wall of resilience in a sandpile, with the US consumer, etc. serving to absorb the cascading energy of manufacturing and housing, what would it look like if/when that damn begins to burst? What the initial of that process be more likely that of a significant gusher or a trickle?
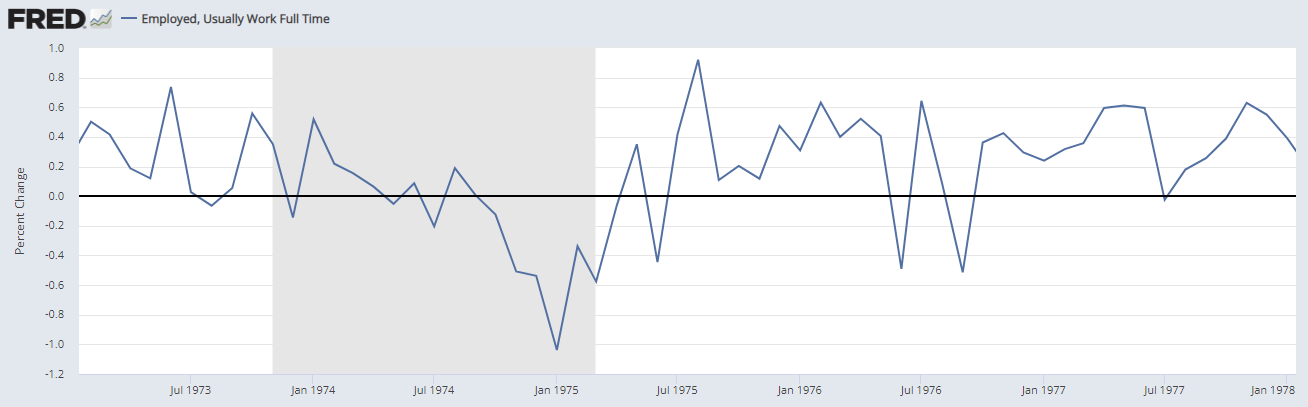
As part of the Seminal Singularity piece, I reviewed the 1974 labor market dynamics, which seemed to hold up pretty well through the first 10+ months of that recession before a dam burst late in summer and into autumn that year. This chart shows the sequential rate of change in full-time workers reported in the Household Employment Survey, released monthly. The secondary peak shown in 1974 was August and from there the sequential drop to the low rate in January 1975 was about 1.23%, from positive 0.19% to -1.04%.
Here is the most recent data:

The October secondary peak was 0.27% and the most recent report for December was -1.14 for a total move of about 1.40% (rounding).
With the important caveat of it being a single data point amidst the Fog of Cycles, it is certainly possible it will get revised away, was a data quality problem, etc.
But given the setup, through the lens of Kayfabe self organizing criticality, it could also be evidence of phase transition to the very unusual shock absorbers present this cycle finally capitulating.
Excellent as always my man, thanks for these writeups - they have definitely helped me broaden my views.