

Galilean Apostasy

Recent employment and inflation reports served to catalyze a new narrative - no recession! This is an upgrade in delusion from the “Fed Pivot” obsession that took hold last summer, almost immediately following the Fed’s initiation of 75 bps rate increases.
This past Monday, February 13, 2023, marked the 390th anniversary of Galileo’s arrival in Rome to face charges of heresy for agreeing with Copernicus’ theory which placed the earth’s sun at the center of the universe.

For several thousand years, many of the most erudite medical experts in the human species used bloodletting as a medical ‘treatment’ for all sorts of ailments.

Contemporary business and inflation cycle analysis remains largely in the ‘dark ages,’ where many common tropes, models, and analytical frameworks remain similarly antiquated.
One of the latest nonsenses to emerge as a focus of the dark age scene is the Atlanta Federal Reserve Bank’s GDP Now model, which is supposedly a ‘real time’ estimate of each calendar quarter’s advanced GDP report for the United States. I have seen many people reference the latest model update from this past week printing a 2.5% estimate for Q1 2023 GDP as ‘evidence’ that the US economy is re-accelerating. Here is the Fed’s own disclosure on the model’s error rate, using the number of days preceding the eventual advanced GDP report date:
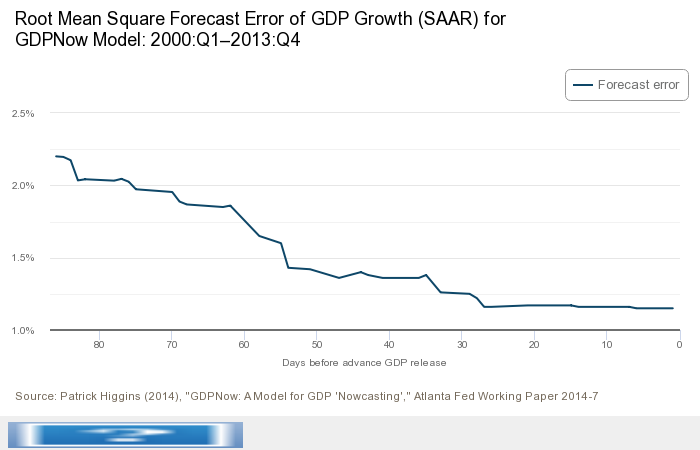
Even if one believes in the efficacy of this sort of model (flat-earthers!), the Fed disclosed how poor the model has been outside of 30 days from each advanced GDP report date. Since the Q1 advanced report is currently scheduled for April 27th, that puts the February 16th report at 70 days out with its 2.5% ‘estimate.’
This was from the Fed’s own working paper on the model from 2014:
The forecast error variance of GDP growth for each of the GDPNow model, Blue Chip, and the Federal Reserve staff's Green Book is decomposed as the sum of the forecast error covariances for the contributions to growth of the subcomponents of GDP. The decompositions show that "net exports" and "change in private inventories" are particularly difficult subcomponents to nowcast.
Given that the most volatile and cyclical components of the economy have a lot to do with things like the “change in private inventories,” the model is….well….
As referenced in last month’s Poolside Polka, GDP is not even a metric that is heavily relied upon when measuring the business cycle…so why would someone focus on an admittedly bad estimation model of GDP for cycle analysis? Why did George Washington’s doctors likely kill him by intentionally bleeding him out?
Economic Cycle Research Institute (ECRI) is a member of the Circle of Trust because I believe their business and inflation cycle analytical framework is the “Copernican Theory” of the domain- derived from the works of Wesley Mitchell and Geoffrey Moore, along with many others such as Ruth Mack.

Lakshman Achuthan’s appearance this week on the Macro Voices podcast provided an invaluable window into where business and inflation cycles are at present, likely heading in the coming months, as well as an education on how cycles actually “work.”
Listening to the interview is a REQUIRED HOMEWORK ASSIGNMENT for all The Worked Shoot readers. The sections on money illusion and the materiality of cyclical industry job losses in recessions were of particular note, in my opinion. The graphic related to job losses in the interview can be seen here.
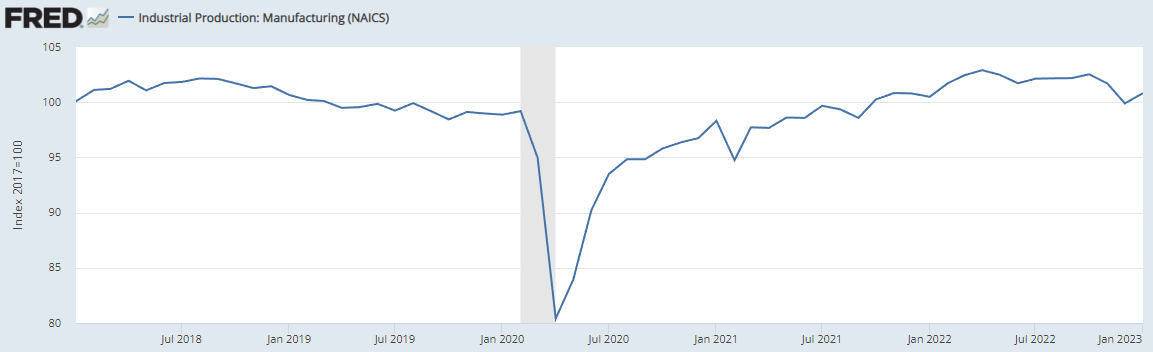
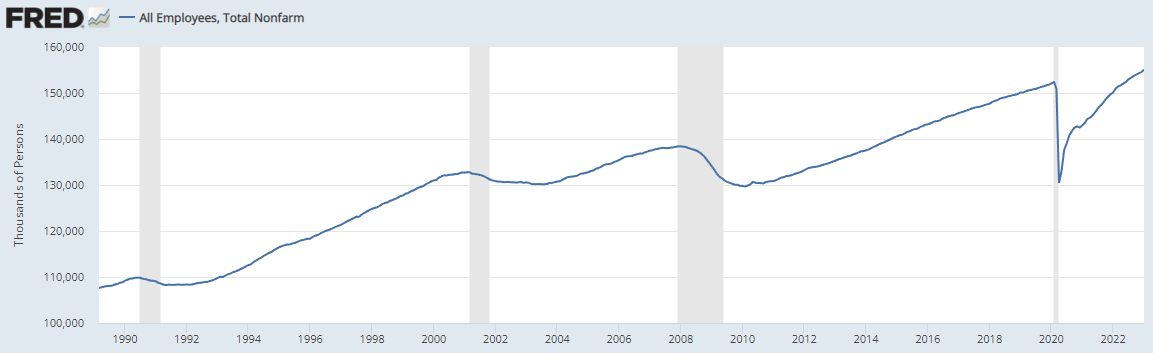
Despite the widespread narratives about a “soft landing” and the US economy supposedly strengthening, the broad measures of the economy used to date business cycles suggest otherwise.
Industrial production:
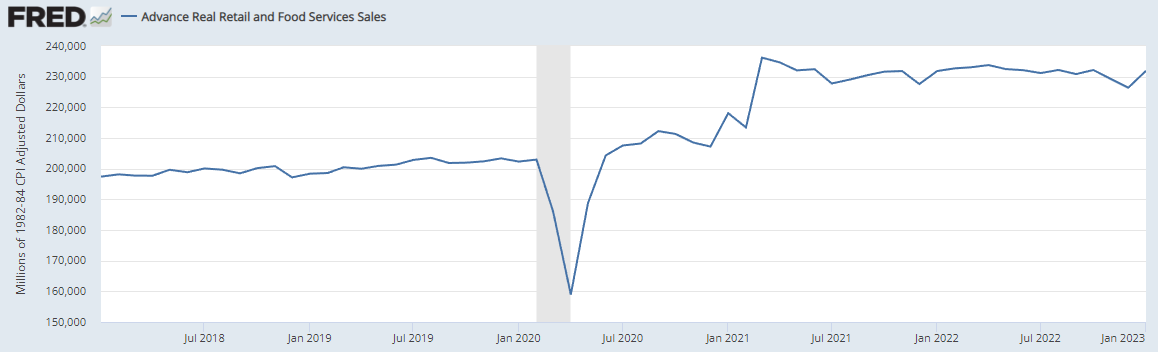
Real retail sales:
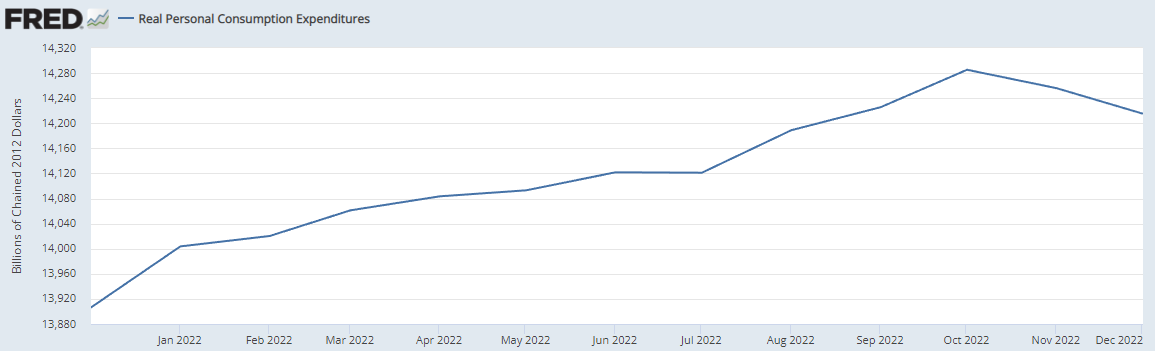
Real personal consumption expenditures:
Real personal income excluding transfer payments:
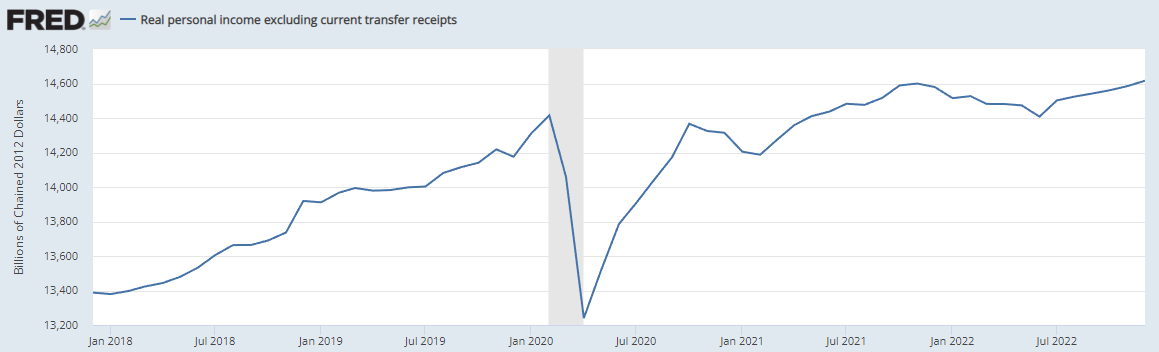
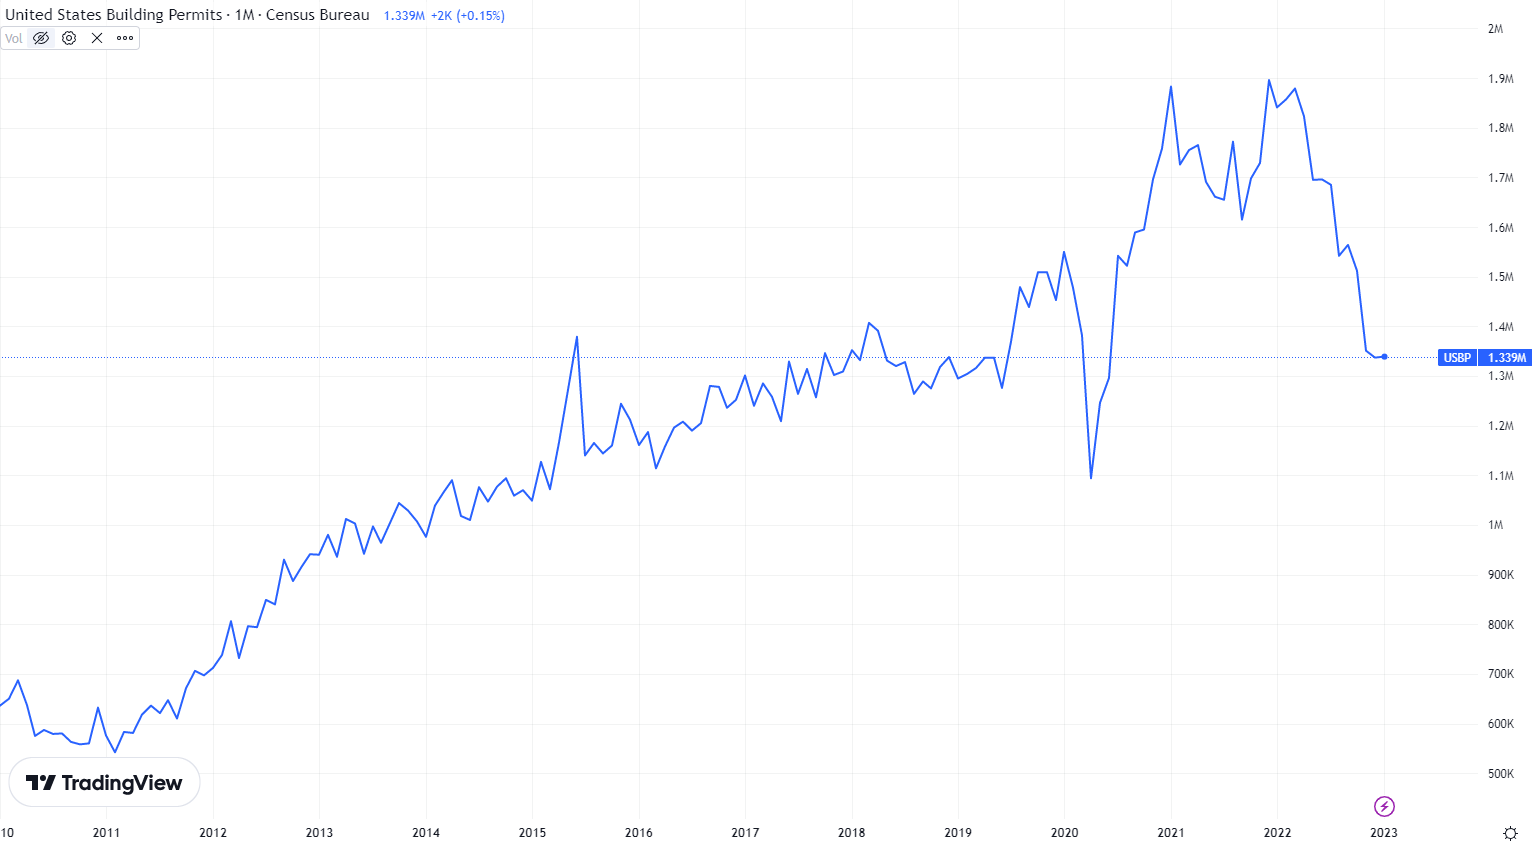
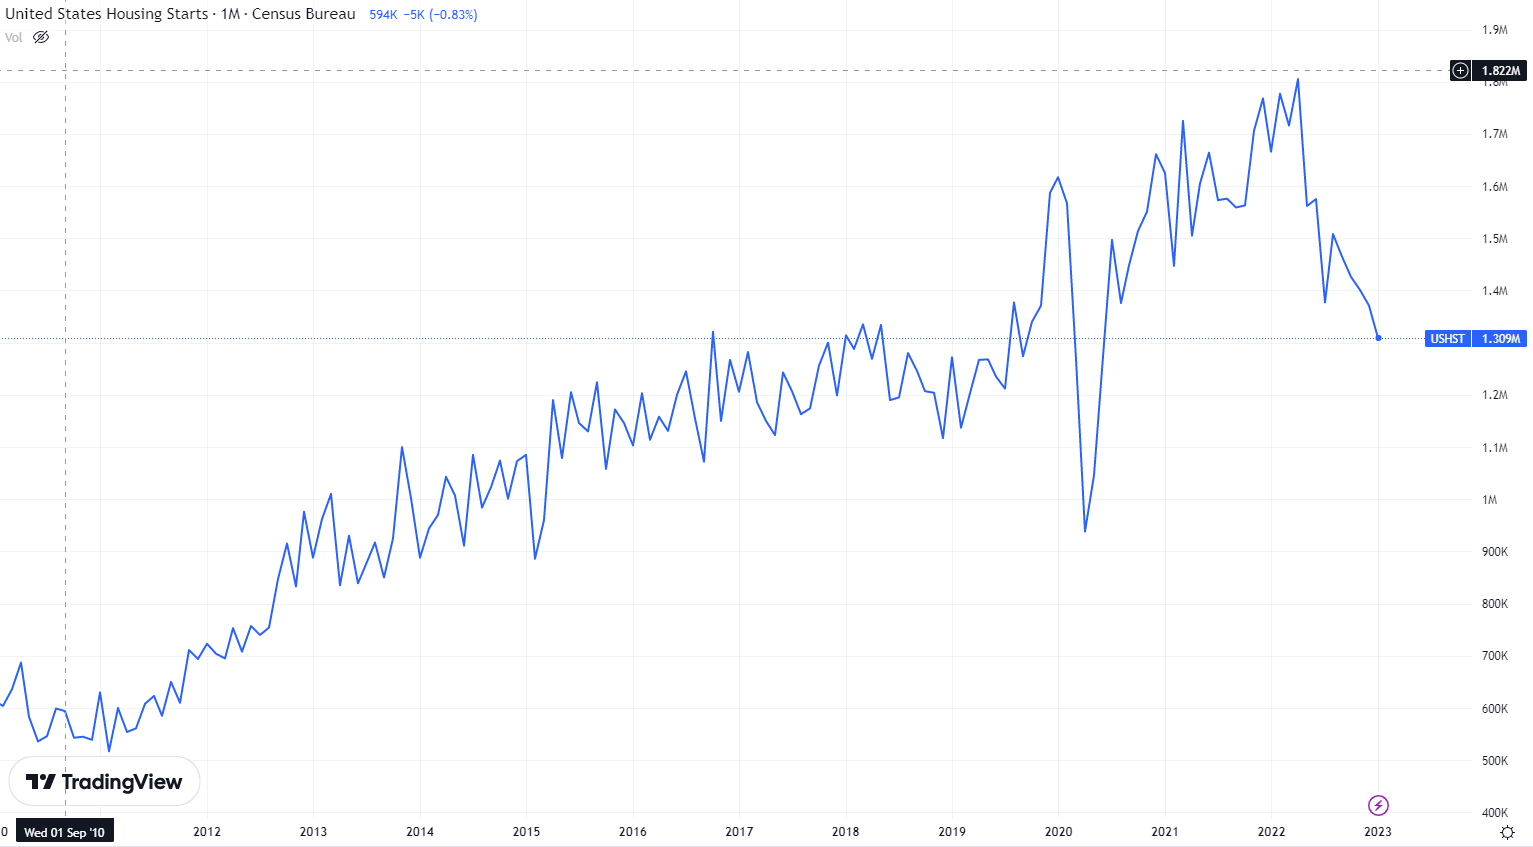
Those are coincident data, with all having made cyclical peaks at various times. Real incomes have turned higher in recent months as reported inflation has declined, but the most cyclical components of the economy have now rolled over. For example, here are building permits and housing starts:
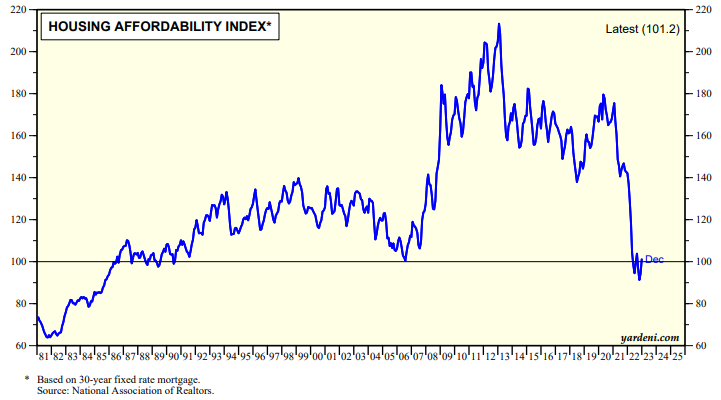
These developments are not just some statistical abstractions, as mortgage rates have moved sharply higher on top of what was an explosion higher in home prices. The combination drove affordability sharply lower- chart courtesy of Yardeni Research:
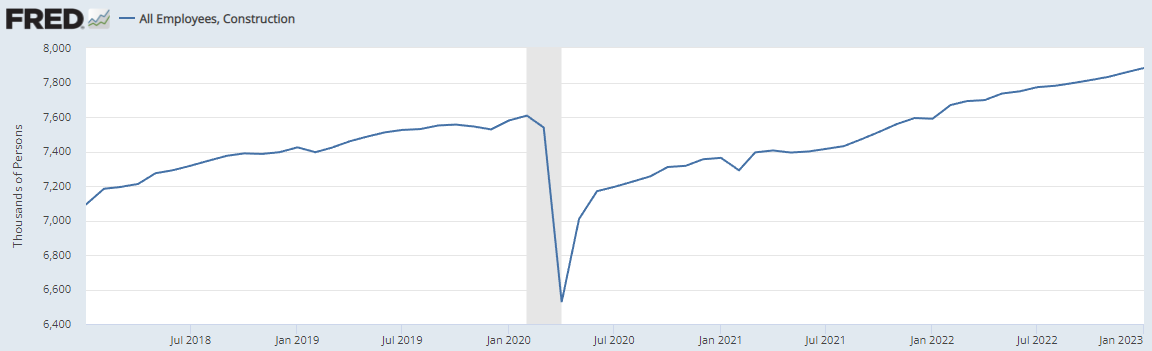
As Lakshman referenced in the interview, construction jobs remain bountiful…for now:
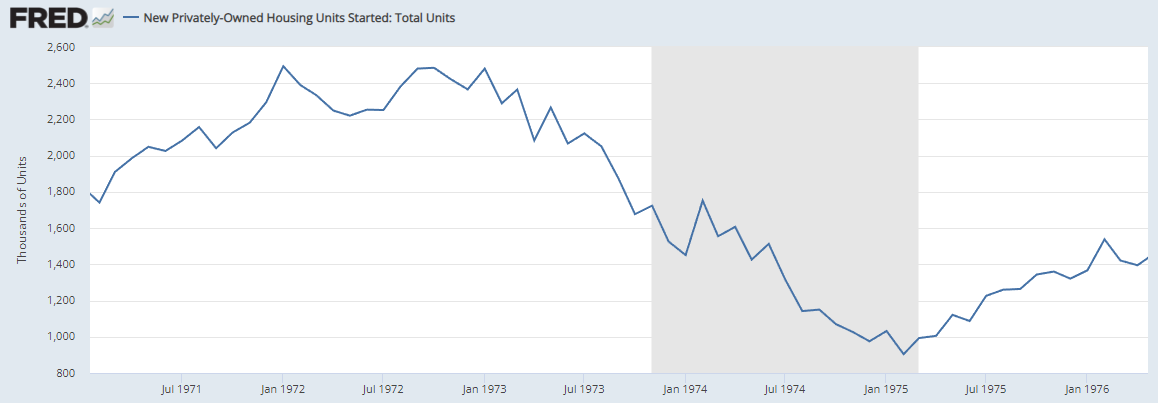
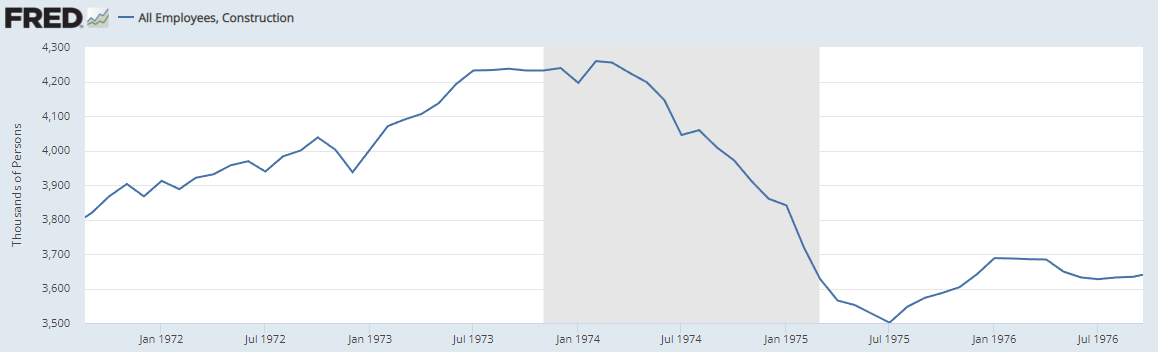
Labor market disruptions, shortages, and hoarding make sense given the post-pandemic period and within the context of the money illusion of high but falling inflation. Here were housing starts and construction jobs around the 1973-1975 recession:
Yes, the jobs market remains in a period of tightness with the long shadow of the pandemic period and related distortions persisting.
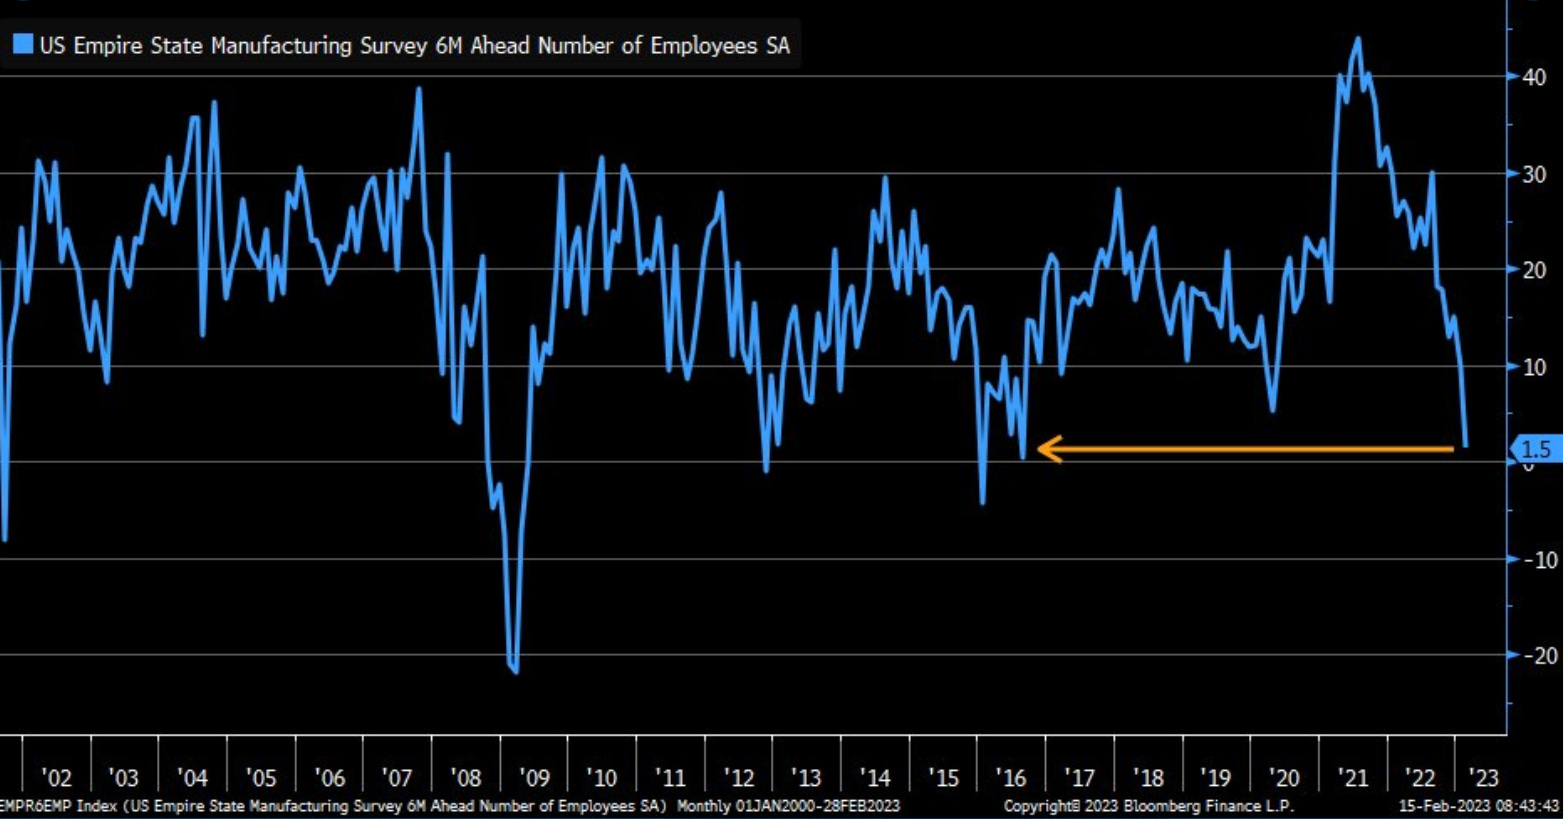
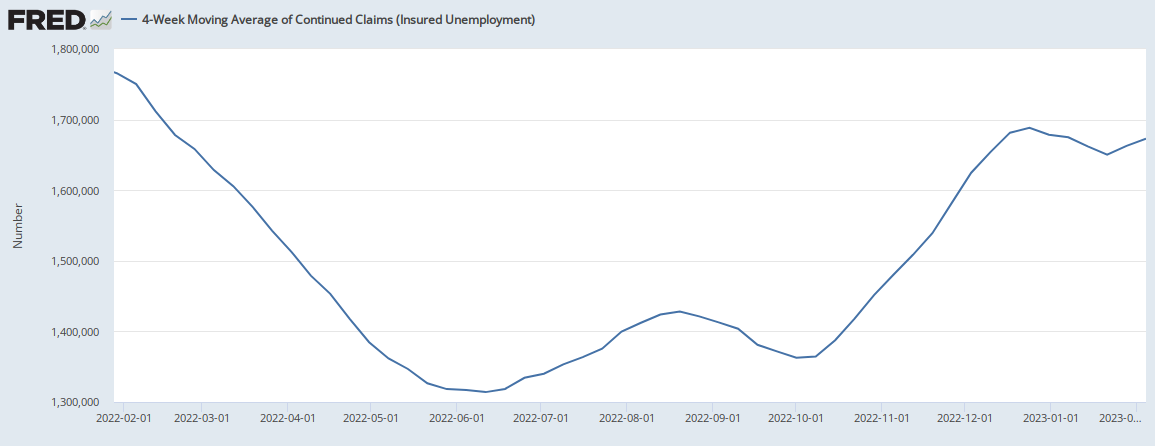
However, various leading indicators for employment have already turned, such as employment expectations for manufacturing and continuous jobless claims:
As relayed by Lakshman, this current backdrop is occurring with ECRI’s global long-leading indicator ALREADY at levels that suggest severe global recession. That is before any potential major credit market issues, exhaustion of pent-up consumer and corporate savings from pandemic “stimmies,” or any number of other potential shocks and hidden interdependencies manifesting.
Fortunately, government and central bank policies are being decided by people fully grounded in a best-of-breed analytical framework for business and inflation cycles….right?
From a New York Times article in 2014 reporting upon transcripts released for 2008-era Federal Reserve meetings:
On the morning after Lehman Brothers filed for bankruptcy in 2008, most Federal Reserve officials still believed that the American economy would keep growing despite the metastasizing financial crisis.
The Fed’s policy-making committee voted unanimously against bolstering the economy by cutting interest rates, and several officials praised what they described as the decision to let Lehman fail, saying it would help to restore a sense of accountability on Wall Street.
James Bullard, president of the Federal Reserve Bank of St. Louis, urged his colleagues “to wait for some time to assess the impact of the Lehman bankruptcy filing, if any, on the national economy,” according to transcripts of the Fed’s 2008 meetings that it published on Friday.
Renewed concerns over inflation and delusion about a “soft landing” have resulted in market-based interest rates adjusting sharply to expectations of the Fed staying the course with higher rates. Fed leadership is no better informed or equipped to centrally plan the current cycle than they were in 2007-2009, the 1970s, or the 1930s, IMO. I believe their apparent policy path and the related market moves continue to exponentially increase the risks of extremely dangerous cycle forces being unleashed.
Along with ECRI’s framework, the other three pillars of Kayfabe Capital are now screaming extreme cycle-timeframe caution. I am being explicit in ringing the alarm bells, after a year+ of laying out potential risks and pathways to this point.
As they are apt to do at the doorstep and/or early in recessions, many risk markets have exploded higher in recent months. Investors, if there are many left amongst the meme-stock/equity options/0DTE speculative mania degenerates, may do well to use the recent strength to prioritize portfolio resiliency, before the flat-earther alchemists bleed you out.
Lakshman pounded the tables in 2011, announcing the global economy was already in recession, a recession that never came. Why is this time different?
Jeff and Kayfabe,
Lakshman's call wasn't without merit as the alarms on the instruments panel inside the cockpit were flashing red hot during those IFR conditions due to the European debt crisis and the move by Standard and Poors to initiate a downgrade of the U.S. Government's long-term debt from AAA to AA+. Although U.S. GDP only posted negative marks in 1Q2011 and 3Q2011, the S&P 500 still plummeted (21.6%) from 5.2.11 to 11.4.11. Furthermore, to kick the can down the road and avoid an unquantifiable global recession, the ECB expanded its balance sheet to deal with the crisis, increasing total assets by +63% to €3.02T (FY2009 to FY2012). Since FY2009, the ECBs balance sheet has skyrocketed +330% to 7.96T. Concurrently, the U.S. C.B.'s balance sheet has ballooned to incomprehensible levels. So it is not if the C.B.'s fail...it's when.
I enjoyed this substack piece, Kayfabe!