

Kayfabe Carnage

This is the 2nd annual comprehensive review of the Kayfabe Capital analytical framework we look towards 2023. For those unfamiliar, reviewing the framework and last year’s 2022 post may be helpful in placing this one in context.
This year I am adding a summary at the top. The amount of potential content to cover is staggering, and it is impractical to be fully comprehensive. Hugely important developments like those in housing and labor markets are not addressed, but they definitely ‘fit’ within the broader framework update. Now on to the show….
Executive Summary
Severe global recession unfolds in 2023
Inflation surprises to the downside….eventually
The pandemic unleashed new macro dynamics associated with policymakers chasing higher cycle volatility
The ‘sandpile’ reached record heights and evidence of a large-scale avalanche cascading, both in the global economy and financial markets, is substantial.
Consensus expectations for corporate America are in la la land.
Business Cycle
We entered 2022 with much of the global economy in a growth rate cycle slowdown, with leading indicators heading down and no signs of an upturn. That trend continued throughout the year. Leading indicators remain pointing downward for the global economy, but are now at recessionary levels, both for the global economy and now the United States. While coincident economic data remained seemingly resilient in Q3 and Q4 2022, I believe the growing gap between the leading indicators and coincident data is likely due to the nature of the current cycle.
The high level of nominal GDP in the US has created all sorts of cycle dynamics that are unfamiliar to most market participants and analysts, as it has been over 40 years since a comparable period occurred. Similar gaps between leading indicators and coincident data opened up during the 1973-1974 and 1980-1983 recessionary periods which were also preceded by high levels of nominal GDP and inflation.
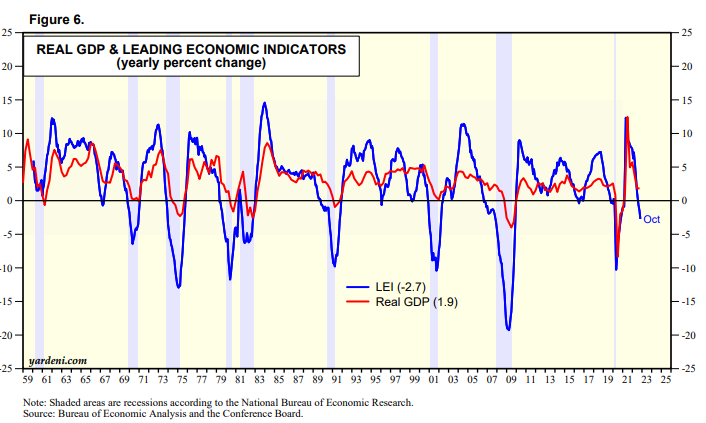
This chart shows the last nine official recessions for the US, courtesy of this report from Yardeni Research. Note the abrupt decline in the LEI which preceded the 1973-1974 recession. Obviously, this chart displays Real GDP which was finalized after various revisions. Also, comparable LEI’s for major economic blocks outside the US are already at levels that indicate deep recessions are likely to unfold.
Revisions to government data can be large once recessionary forces commence. For example, the first quarter of 2008 was initially reported at 0.6% growth in GDP but was subsequently revised down to -1.6%. Positive GDP reports within prolonged recessionary periods are also not uncommon. The Q2 report in 2008 was initially 1.9% and subsequently revised higher to 2.3%! The Q3 and Q4 reports were initially reported at -0.3% and -3.8%, and subsequently revised down to -2.1% and -8.4%.
This dynamic is an example of the “kayfabe” concept - it can be difficult to distinguish between what is real and fake. It is also central to the Fog of Cycles concept laid out here. Policymakers and market participants who conflate recent economic data with forecasting business cycles may be making a grave mistake.
Speaking of a grave mistake:
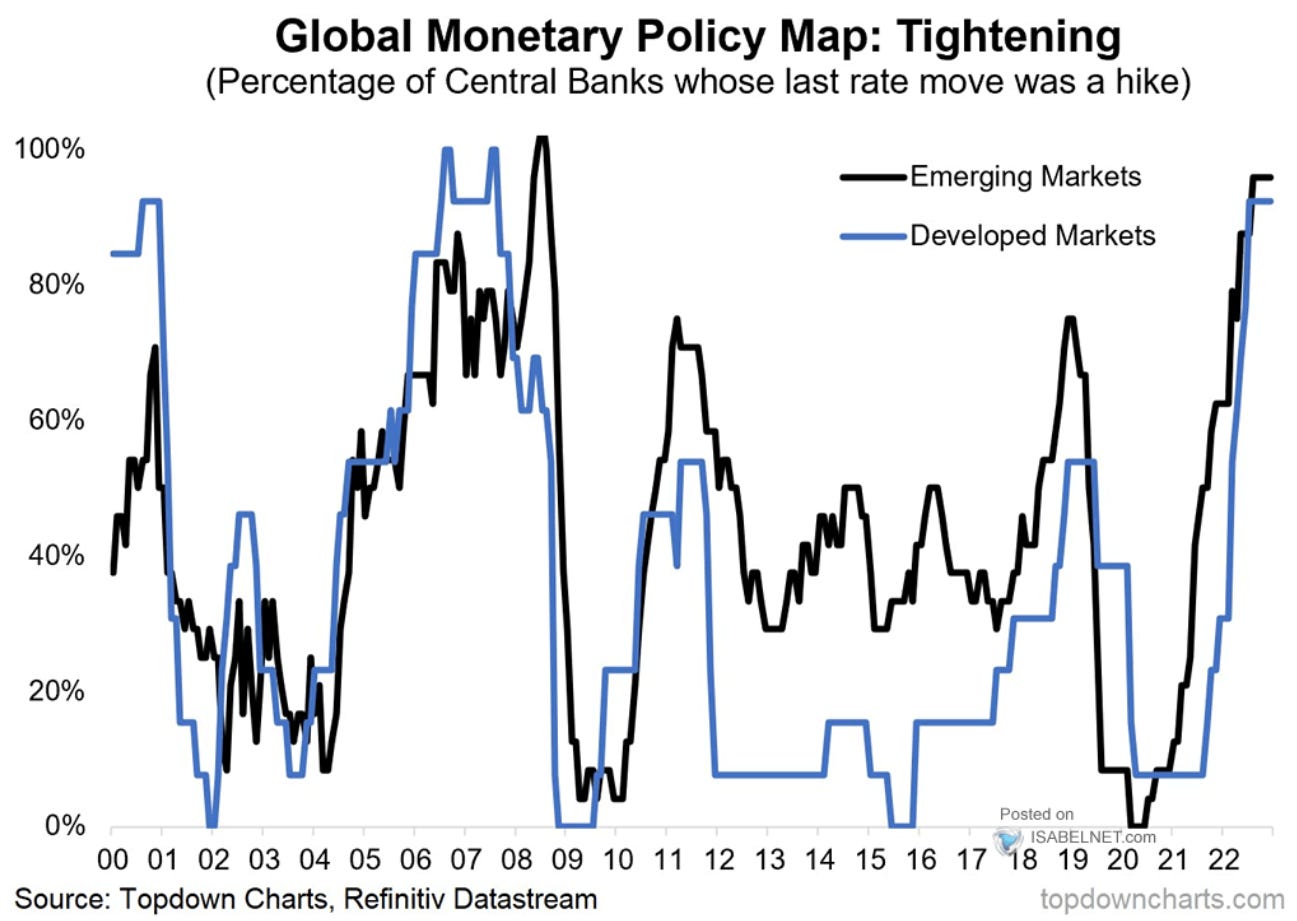
That chart comes courtesy of ISABELNET via Twitter and shows a record diffusion of central banks still tightening monetary policy. Record levels of tightening STILL unfolding with leading indicators suggesting that a severe global recession is already in the pipeline?
The Fog of Cycles also applies to the inflation cycle, where leading indicators are heading lower. A relatively new project, Truflation, offers a real-time way to track price trends in the US and UK without the impact of the various issues with official government data.
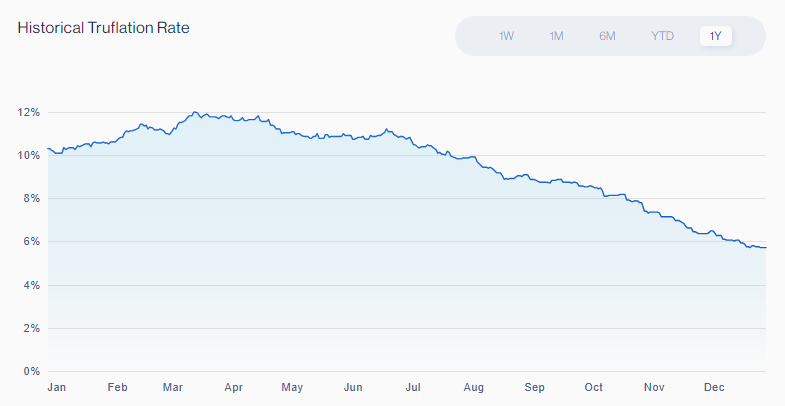
I am not suggesting this methodology is the ‘best’ or any such thing, but it is another tool for assessing cycle-timeframe trends. The year-over-year level in the US has dropped by over half since peaking in the spring. An ironic situation may be emerging, in which the BLS versions of inflation that have been engineered to under-report inflation, may actually understate this cycle’s rate of decline due to issues with owners equivalent rent, etc.
The business cycle component of Kayfabe Capital is suggesting a severe recession will unfold in 2023, that real-world inflation may surprise with how quickly it declines, and that the reaction function of policymakers may be badly impaired due to relying upon flawed models using inaccurate lagging and coincident data. The US economy is lagging behind the global cycle, which further compounds this reaction function issue.
Macro Economy
This is the most uncertain element of the Kayfabe Capital framework, as significant cross currents may be emerging. As laid out in this April The Worked Shoot, I can see a pathway to the dominant macro regime shifting in important ways. Structural issues such as heavy indebtedness, bad demographics, etc., have not changed, but the pandemic period and related policy responses may end up serving as an inflection point for change.
I have been exploring the idea of heightened cycle volatility emerging, with government interventions potentially serving to amplify the trend. The December 16th The Worked Shoot touched upon this a little, and it is a concept I keep finding myself drifting back to think about.
The pandemic resulted in a synchronization of global business cycles and unleashed a new scale of policy responses from governments. The nearly $6 trillion in US federal budget deficits over fiscal 2020 and 2021 were followed by $1.4 trillion in 2022, despite an explosive rate of nominal GDP growth, along with large cyclical tax receipts from capital gains, which are unlikely to persist. Combined with the nearly $5 trillion in the expansion of the Fed’s balance sheet, along with interest rates taken to and kept at zero, a precedence of scale has been established.
Just as the Fed’s poor analysis of the recent inflation cycle culminated in a record degree of ‘chasing’ the cycle higher, I suspect the pendulum is likely to swing back in the other direction as the severity of the global recession becomes realized. If the fiscal authorities were willing to run a $1.4 trillion deficit amidst the largest cost of living crisis in over 40 years, how big could they go once the human costs of a prolonged severe global recession become evident? That is with the following CBO projected increases, which do not incorporate a severe global recession or potential regime change I’ve laid out:
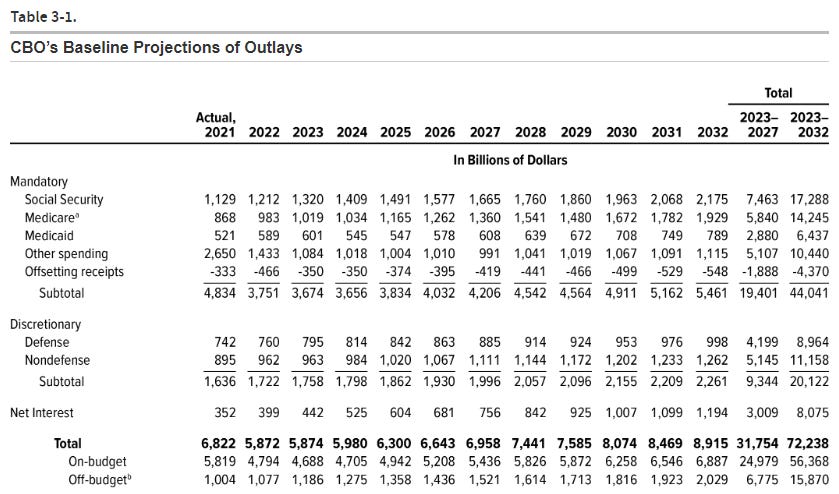
We can see that the actual 2021 spending level for mandatory programs exceeded what the CBO recently forecasted for 2029. This orgy of federal spending has taken place just as the ‘hockey stick’ for Baby Boomer entitlement program spending occurs, with SSI and Medicare forecasted to increase by almost 50% for fiscal 2030 versus 2022. All this assumes no recession during the period, let alone an acute onset of a severe global recession on the doorstep.
The increasing scale of brazen corruption was again put on display with the recent US omnibus bill, and the political class, similar to the 2020-2021 spending, may need to distract from the graft with substantial ‘stimis’ to the masses.
Even a severe global recession will eventually end, and coming out of the other side may occur with pandemic-esque levels of stimulus and continued geopolitical/supply chain/commodity supply constraints remaining. Severe recessions are typically followed by at least initial periods of sharp recovery, all of which could be amplified pendulum-style via the dynamics mentioned. Inflation would come roaring back, interest rates move sharply higher, policymakers continue chasing, etc….rinse and repeat.
Complex Systems
I warned this time last year that this part of the Kayfabe Capital analytical framework was the most troubling. Thinking of the global business cycle and financial markets through the lens of the sandpile model, trends heading into 2023 remain extremely troubling.
The potential for the global economy, or sandpile, to be cascading together introduces all sorts of underappreciated non-linear dynamics. For example, China has been at the forefront of the global downturn, and recent news of a shift in their government’s policies surrounding lockdowns has resulted in some optimism. Through the lens of the sandpile, this would be a sort of renormalization for the Chinese economy, from which a cyclical recovery could emerge.
However, the Chinese economy is just one section of the global pile. Given the scale of the interconnectedness of the US economy with the global pile, that section of the pile starting its cascade will have a reflexive impact on other sections of the pile, including China. A nascent cyclical recovery driven by increased domestic activity could be subsumed by falling demand from what remains an extremely large trade partner.
The US economy’s impact on the rest of the world, particularly emerging markets, is often referred to as the “bullwhip effect.” As US demand falls via recession, the downstream effects on the rest of the world economy are significant. Recent history has not included a period in which the US economy is effectively pulled down to join an emergent global recession. The US entering recession, in yet another pendulum-style swing, will compound what is already unfolding:
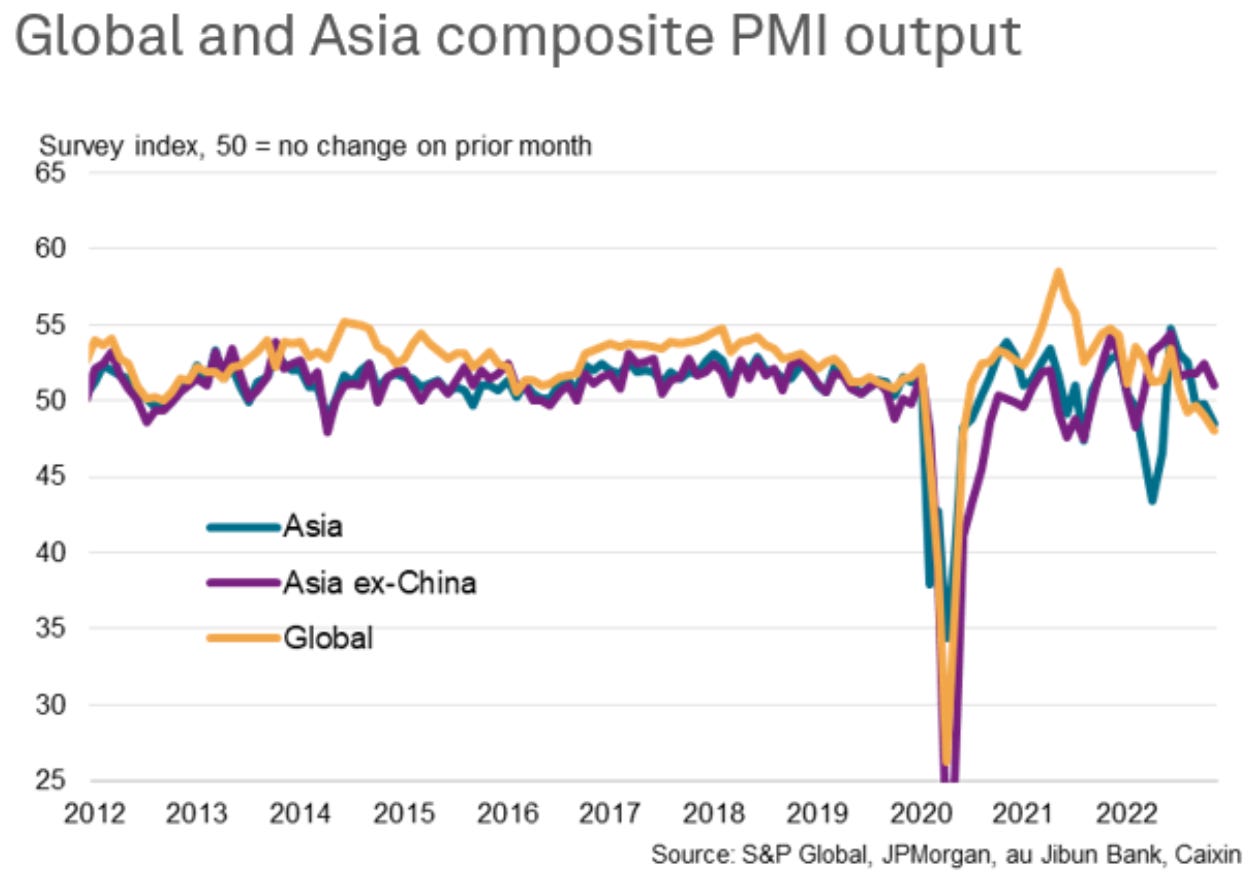
S&P Global PMI’s are already below 50, the level below which suggests contraction. That occurred before the US entered a recession and the bullwhip effect has been unleashed. Here is the Eurozone:
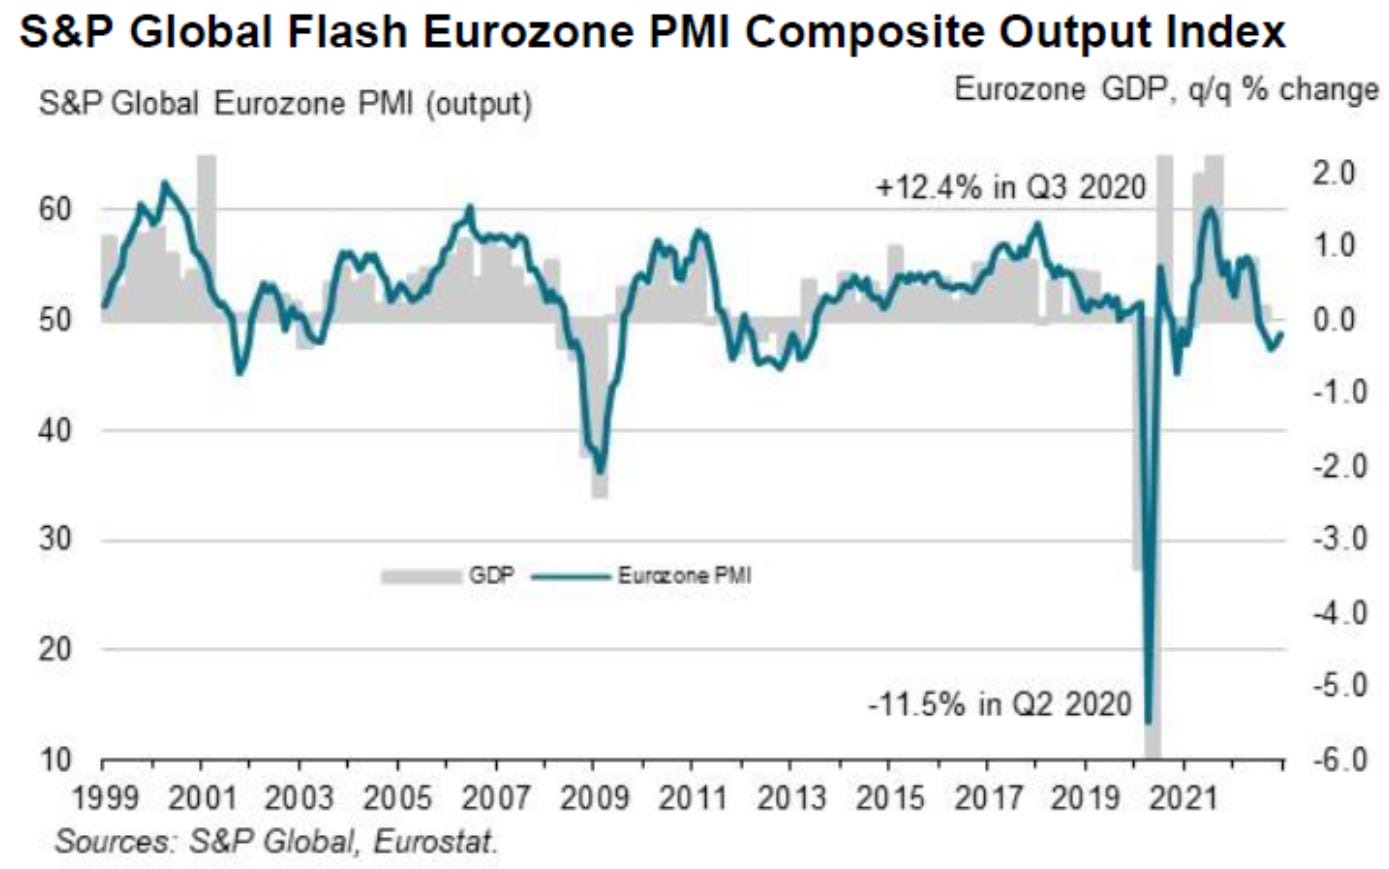
Just into contractionary levels, but again before EU recessionary conditions accelerate and the US enters recession. Another element of complexity are the hidden interdependencies that seem to come out of ‘nowhere’ as the sandpile cascades. The past autumn’s crisis in the UK’s pension system, a recent example of Schrodinger’s Bak. These sorts of shocks serve to accelerate cascades, as the Lehman Brothers bankruptcy did in September 2008.
With global leading indicators ALREADY suggesting a severe global recession is baked into the cake, it should be alarming that this has transpired BEFORE any large shocks have occurred.
Given the diffusion of central bank tightening combined with the risks surrounding a slow reaction function from the US Federal Reserve, the eventual ‘pivot’ is more likely to be accompanied by confirmation of an accelerating shock rather than a catalyst for a cyclical inflection point.
In my experience, the non-linear nature of these dynamics is completely lost on policymakers and most of ‘Wall Street.’ Much of this section has been conceptual so far, but if you revisit this The Worked Shoot from last December, I shared a chart of the German DAX, which at that point had begun to display self-similar scaling in price. This continued throughout the year and has continued to scale - obviously the US markets were subsequently subsumed ‘down sandpile’ after peaking in January 2022. Here is an update of the DAX with the same price iteration now scaled to the monthly timeframe - one I commonly use when analyzing cyclical dynamics:
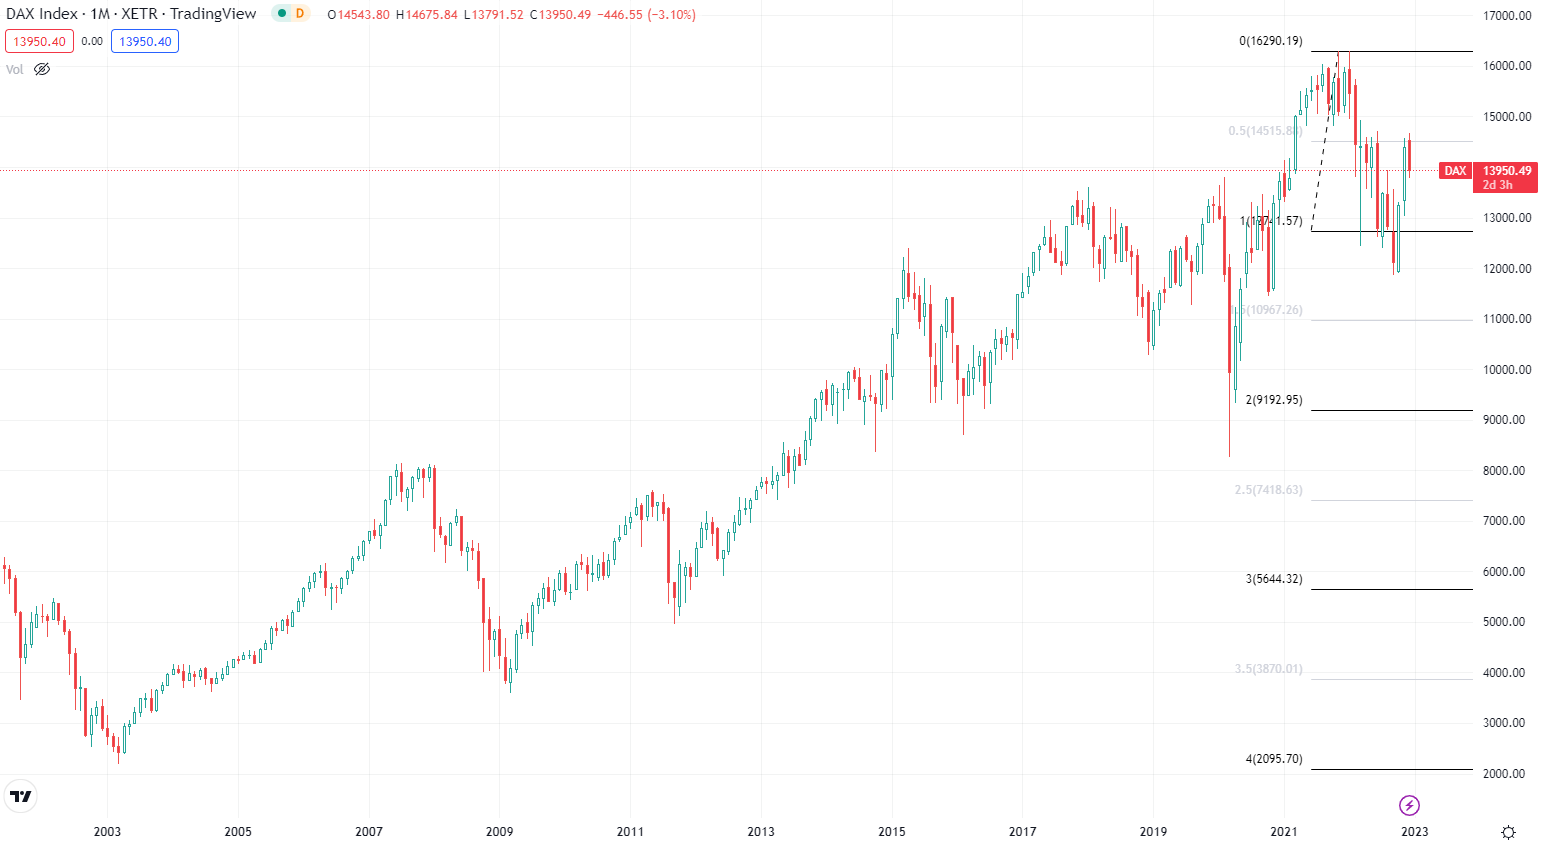
The chart offers some context for historical price levels should the ‘avalanche’ continue to scale as I believe it will. Would a revisiting of the 2020 lows be shocking given the backdrop of events unfolding in Europe amidst a severe global recession? How about the 2012 lows which preceded Draghi’s infamous “whatever it takes” speech?
Traditional Investment Analysis
I have not covered this aspect of the Kayfabe Capital framework much in 2022, as the dynamics entering the year were so one-sided. As prices and valuations have begun to decline, conventional investment analysis becomes more nuanced. The most prominent theme I wrote about in 2022 was covered in An Optimistic Catastrophe back in May.
From a cycle timeframe perspective, the bubble conditions reached in 2021 were not only about price but also reported earnings. This ‘story’ has been complicated in 2022 because of various inflationary illusions which occur when the economy experiences high periods of nominal GDP that precede a recession.
As economic activity has slowed in 2022, unit volume growth has stagnated or even begun to decline for many businesses. However, price increases and things like FIFO (First in first out) accounting can create a temporary inflation illusion. As economic weakness progresses and eventually unleashes recessionary forces, the decline in units will accelerate, price increases will subside and possibly reverse, and the reservoir of relatively cheap cost of goods sold will be exhausted. Despite very high nominal GDP growth, per Factset, S&P 500 earnings growth year over year ex-energy has already turned negative:
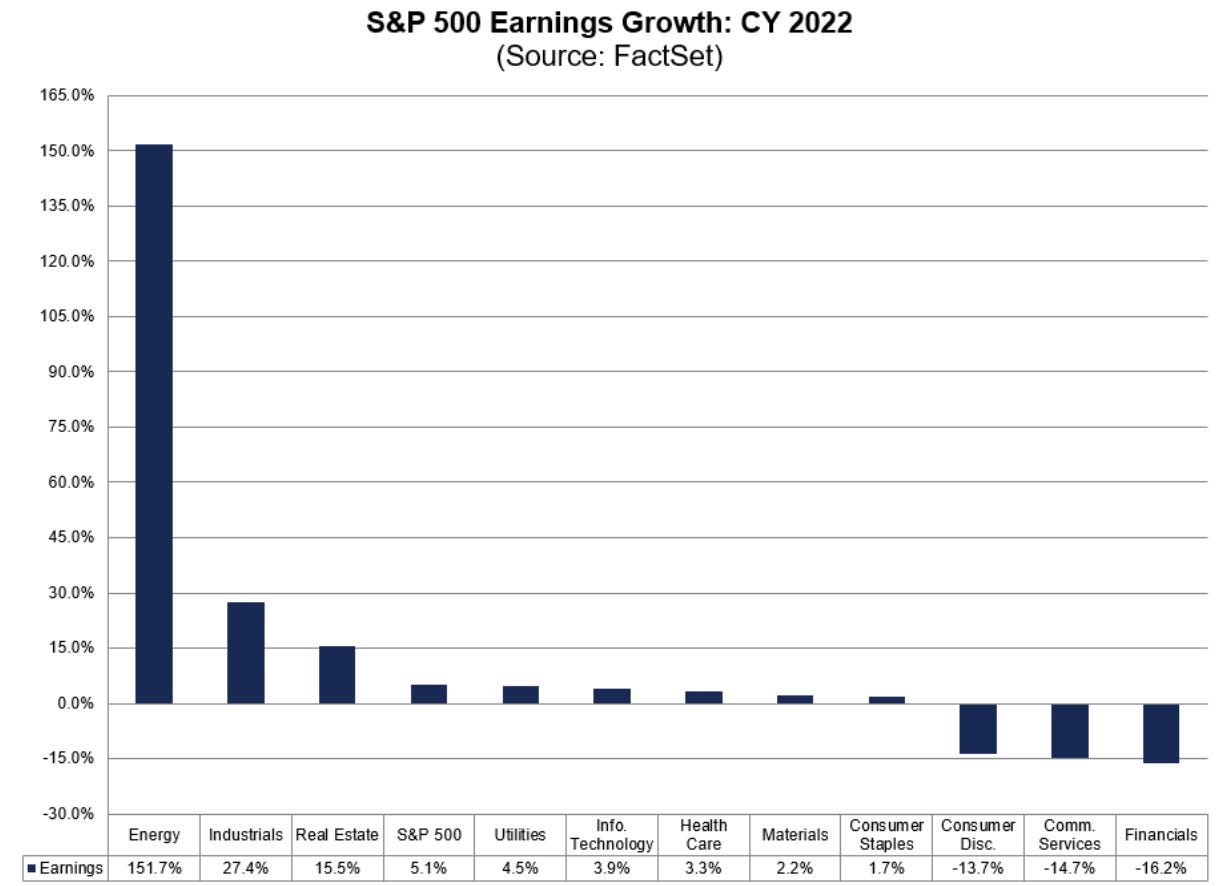
Methodologies for the reporting of earnings differ, so I am just showing this chart due to the convenience of a quick search result. Going back to some scenario analysis as I did in the piece from May, here are some operating EPS estimate ranges:
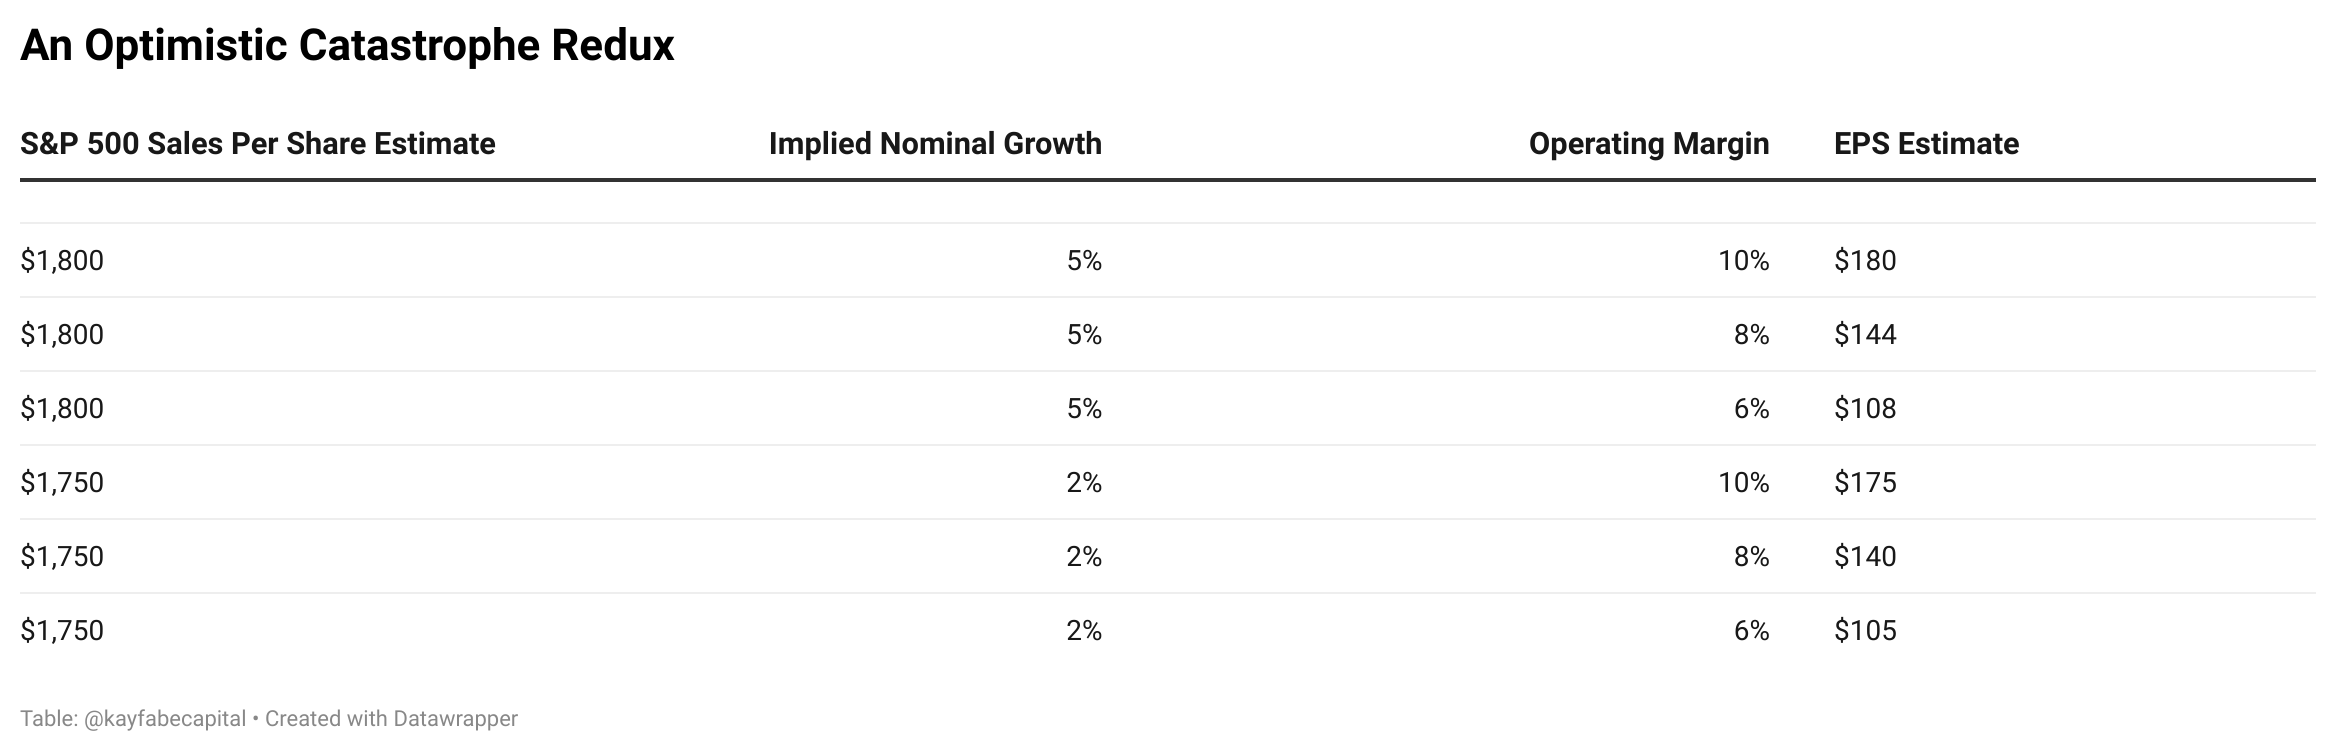
To place this into further context, the current Wall Street consensus estimate for 2023 is about $230, which implies an operating profit margin of almost 13% using $1,800 in sales! Even the most ‘bearish’ amongst the strategists have estimates that are way too high even for a ‘mild’ recession, let alone the potential for a severe global recession. Even a 6% margin would be higher than the trough level reached in either the 2007-2009 or 2000-2003 recessionary bear market cycles.
Of course, the entire market is not represented by the S&P 500, and there are always idiosyncratic opportunities. However, this issue with elevated profit margins fueled by the massive pandemic-era stimulus, along with accounting nuance introduced by the inflationary illusion, makes it more difficult not to get caught up in ‘fake’ kayfabe valuation situations. I think this is a particular risk in market segments like small-cap value.
Protect and preserve remains the primary concept for 2023 for the overwhelming majority of individual investors, in my opinion. That became my mantra in January 2022 once evidence began to emerge of a potential cyclical peak in the major US stock market indexes- ‘cash’ was and remains king, IMO.
This option has actually increased in relative attractiveness compared to this time last year, as both nominal and real yields available to hold shorter duration instruments like US T-bills and shorter duration notes have increased. I believe the continued ‘hidden’ value of the liquidity and optionality that cash and related equivalents are now enhanced by those moves in yields.
I will dedicate next week’s The Worked Shoot to other specific investment themes and potential ideas for 2023. One of the reasons I launched Kayfabe Capital and The Worked Shoot was to try and help as many people as possible navigate what I expected to be perilous times for investors. Dealing with the world as it is rather than what we prefer it to be will be even more important over the year ahead.
I wish all subscribers/readers and your loved ones a Happy and Healthy New Year.

Got me thinking about inventory accounting and reported profits during inflation. It will take a couple of years for the majority to catch on. My dad did his graduate thesis on FIFO vs. LIFO when he got an MBA on the GI bill.
Earlier this year with quick rising interest rates (soapbox alert: wish they would distinguish between Fed's short term rates and general longer duration interest rates as the term "interest rates" is too ambiguous) bonds were supposed to be a good place to start getting back into. Now it seems that bonds in any category are more of a trade than a longer term hold. Perhaps market participants are coming around to the idea that the Federal Reserve/Treasury would actually want rates (all of them I guess) around 3-4% annually as it is a textbook solution to debt. Even short term debt (I bought $SHY) is going to have to wait for capital appreciation to offset the current loss. This one is kind of a hold. And what about balanced and target date funds?