
Discover more from The Worked Shoot
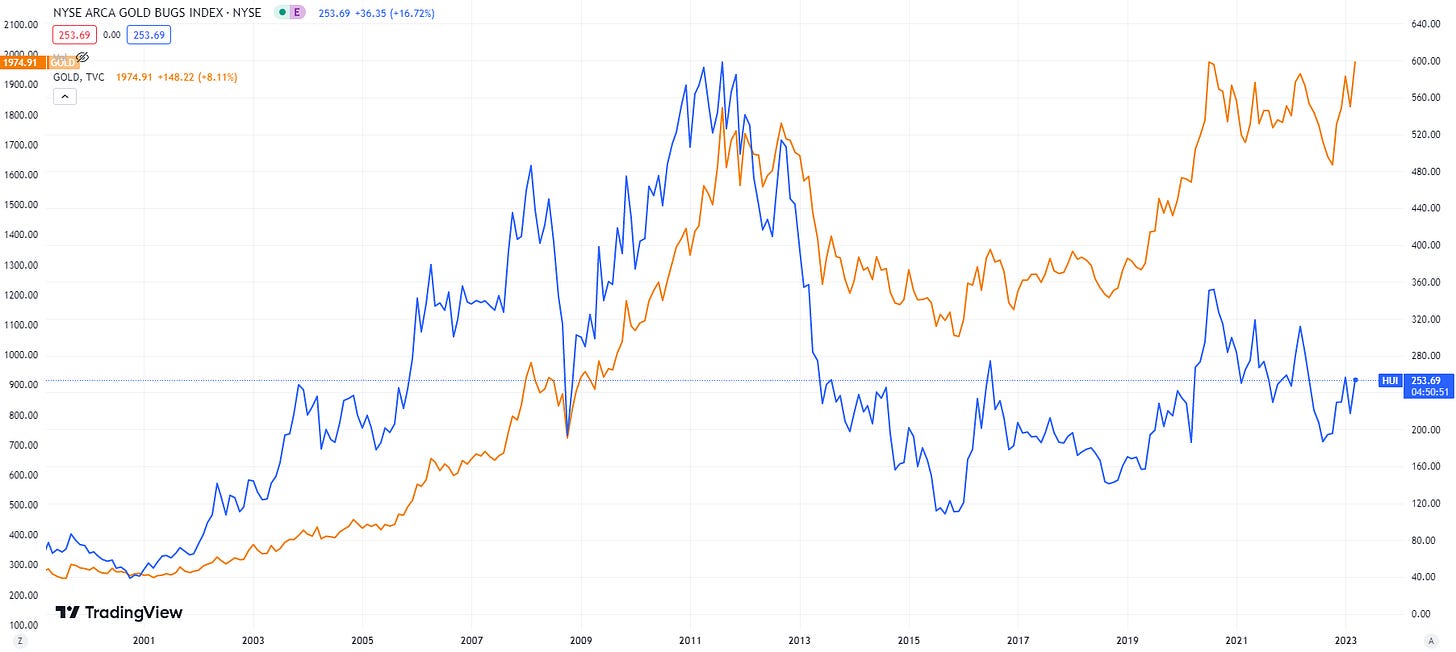
I have been actively monitoring precious metals and related industry equities for over 20 years, and the present is probably the point at which I have been least convicted as to the pathway forward. That history includes the boom times following the end of the UK puking up their gold reserves from 1999 through 2002, when gold launched a five+ year ascension to reach $1,000 an ounce in March 2008.
Over that period, the AMEX Gold Bugs Index (HUI) increased by about 14x’s from trough to peak, while gold ‘only’ increased by about four. By March of 2008, gold had hit all the headlines with the eclipse of the big round number, including across the US in local newspapers. At the time, my cyclical outlook was very bearish on risk assets and the economy, and I used that euphoria as a signal to cut exposure to metals miners by 75%. It was not enough!
The HUI proceeded to collapse by over 70% into the autumn 2008 low, as world financial markets melted down. Gold declined by about 35% and silver by 60%. Those markets all proceeded to explode out of the 2008 liquidation period, move to material new highs, and eventually make secular peaks in 2011-2012. Unfortunately, after having reloaded exposure in September and October 2008, I was slow to respond, as I was caught up in the ‘QE is money printing’ paradigm.
The subsequent decade has been one of sideways volatility in the metals, with mining shares largely decimated, as they remain nearly 60% below the 2011 peak (using HUI as a proxy). Gold has returned to the big round number of $2,000 during the post-Covid lockdown period into August 2020, with several subsequent approaches, including the present.
The last fifteen years have left all sorts of a cognitive mess here at Kayfabe Capital Towers. The current cycle backdrop leaves me with a toxic cocktail of scars and baggage being triggered. With that caveat out of the way, here goes anyway!
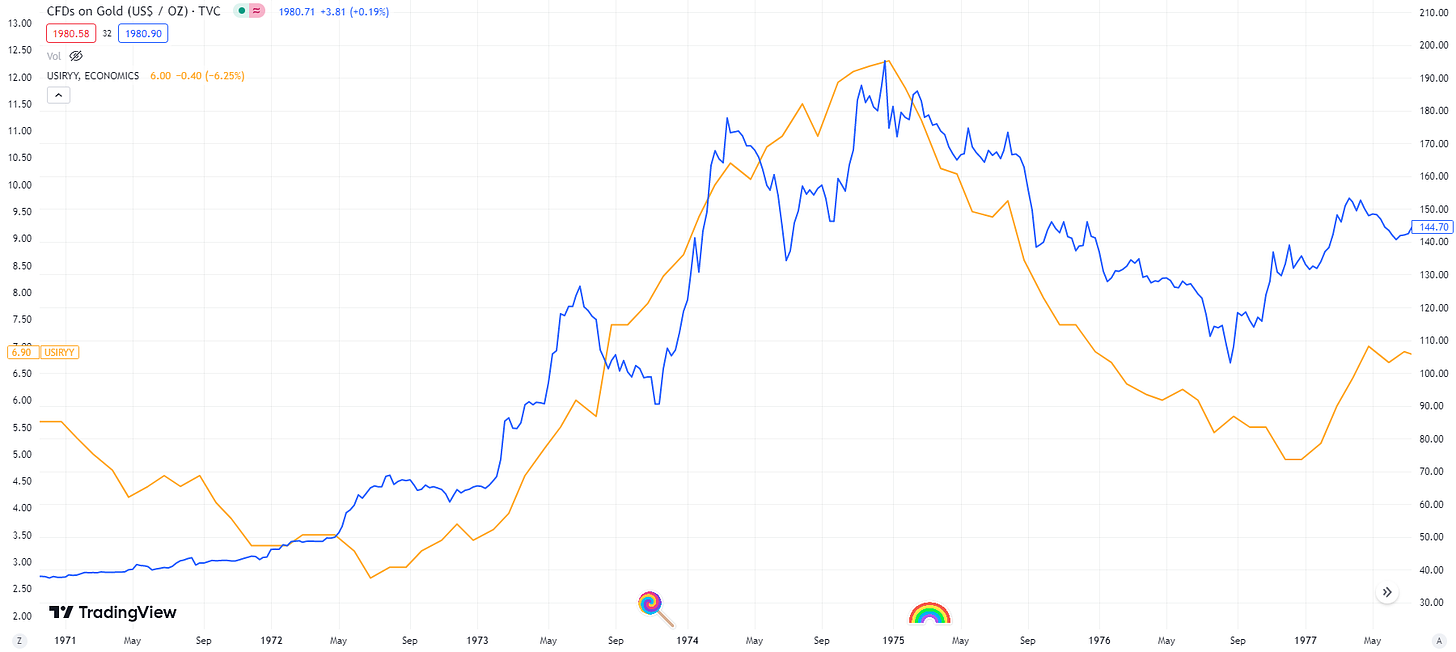
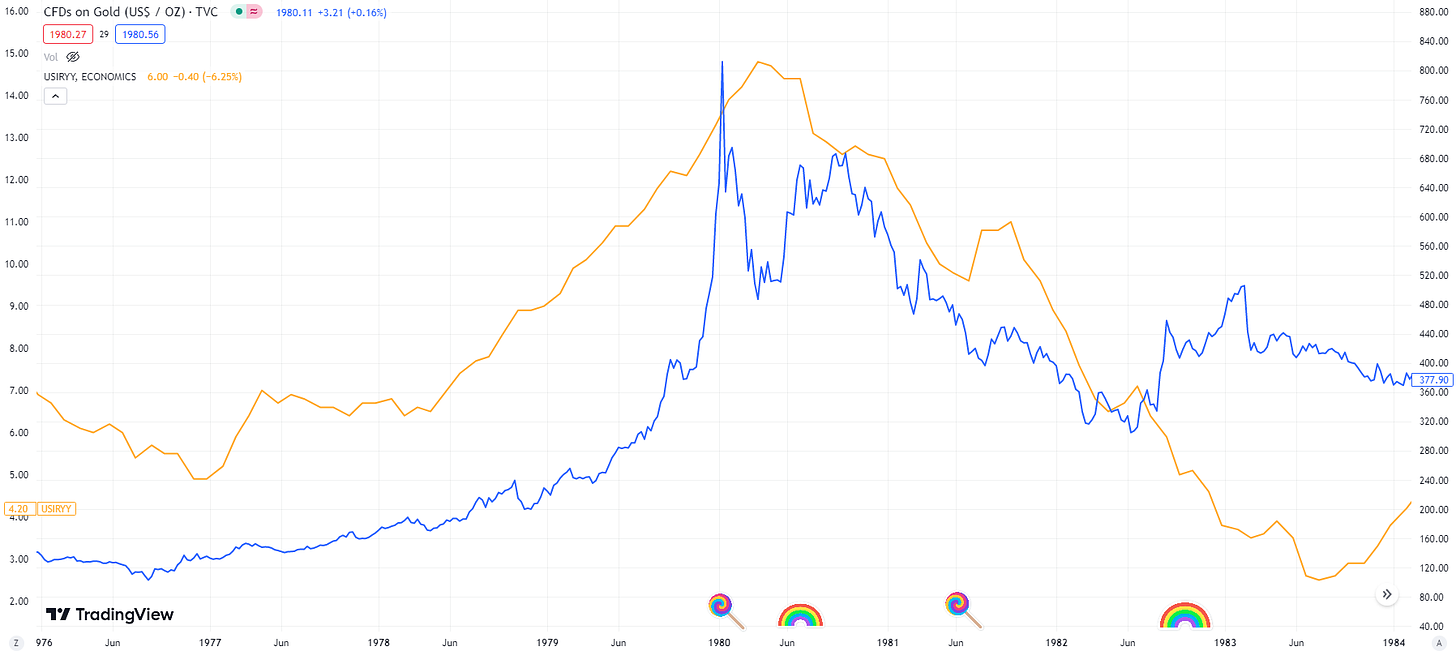
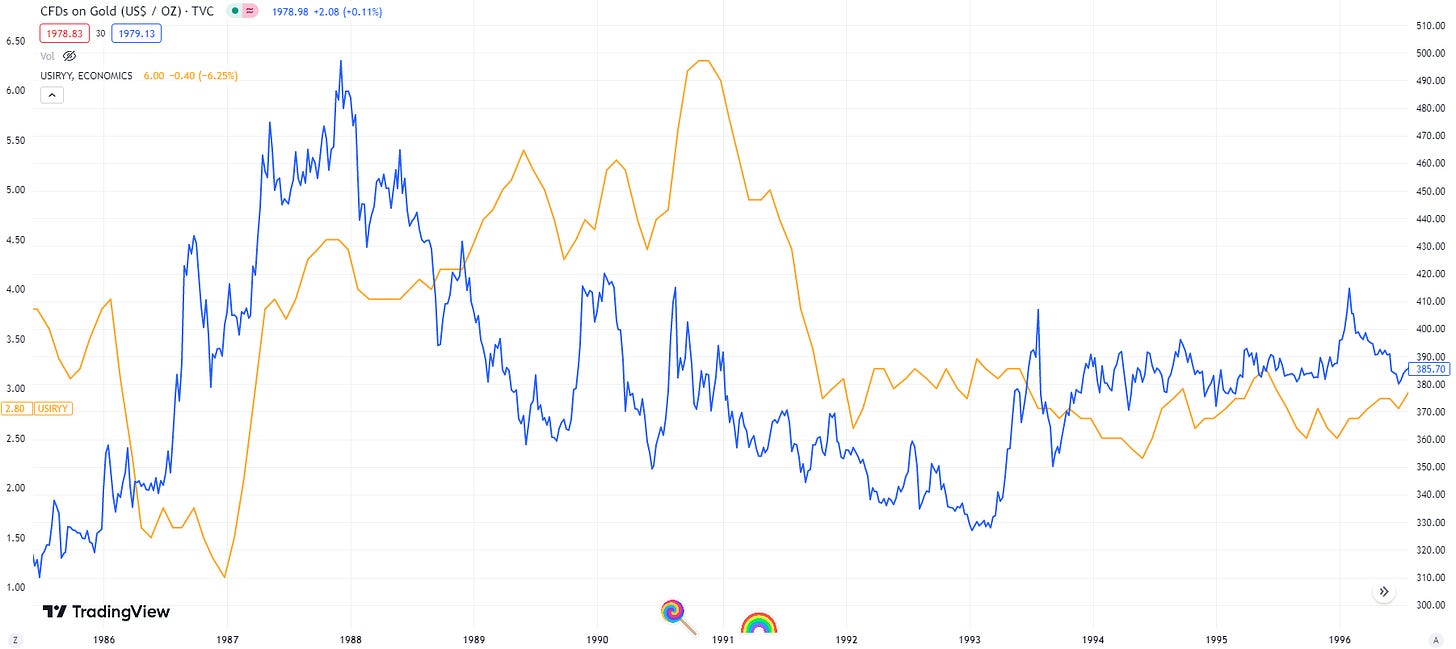
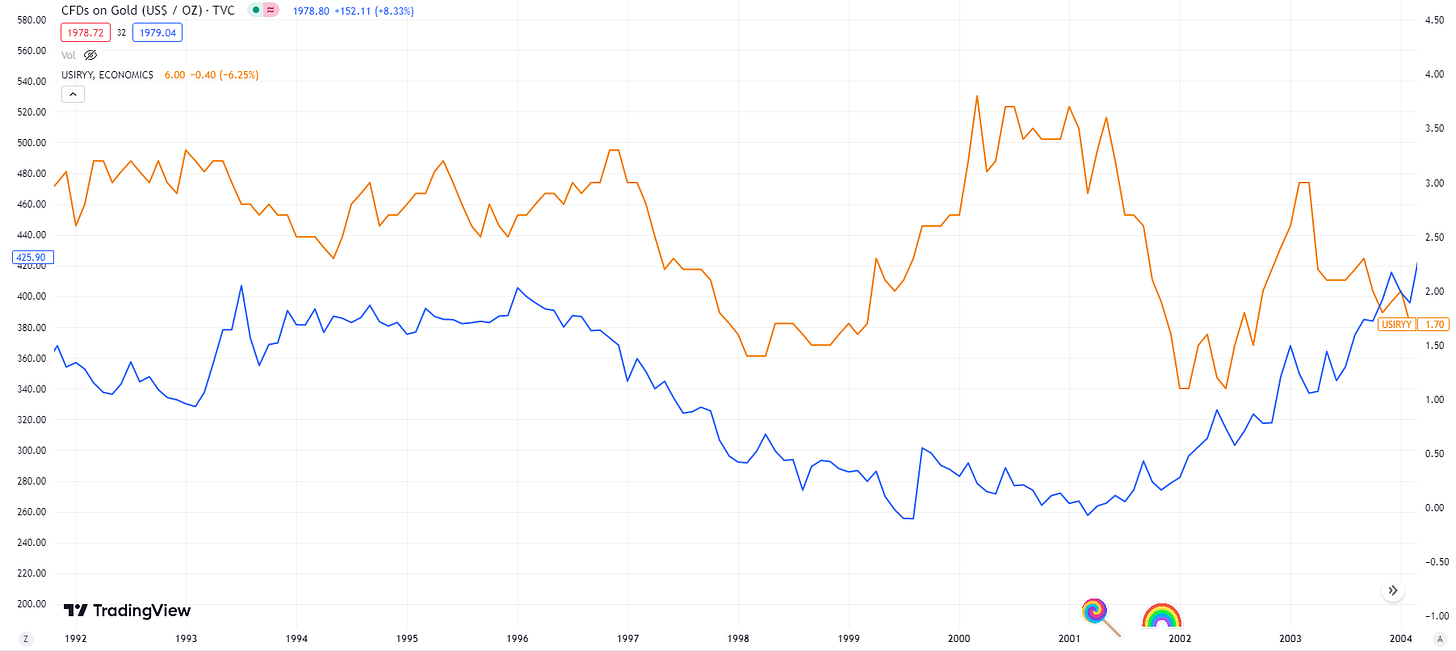
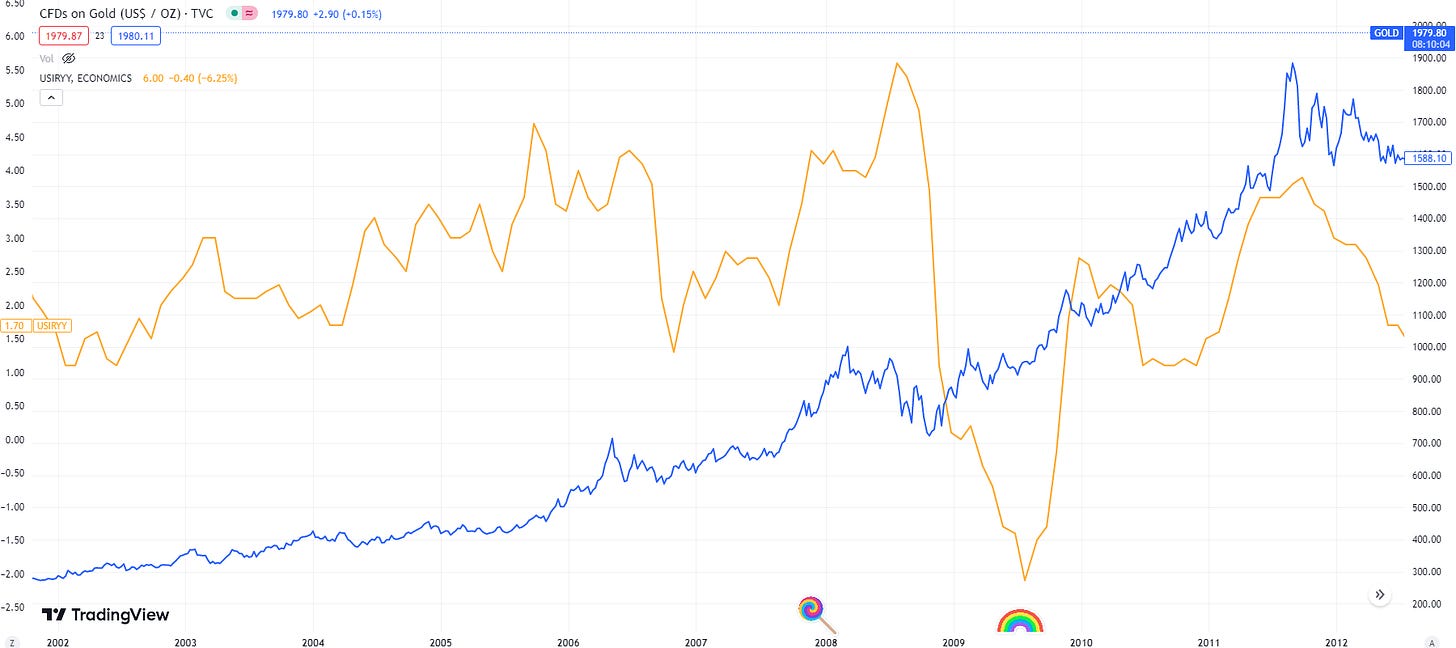
Let us examine the recessionary periods in the US subsequent to Nixon closing the gold window in 1971 - lollipops mark the beginning of recessions, with rainbows as their conclusions. Each chart has year-over-year inflation in gold, and the price of gold in blue (because why would I have thought to make it easy?).
1973-1975 Recession:
A period of high inflation following the oil embargo, with inflation accelerating well into the recession. Gold appeared to begin to discount a cyclical peak in spring 1974, but then resynched with inflation prior to both rolling over in tandem. We see gold again began to discount the cyclical trough in inflation ahead of the late 1976 bottom.
1980-1982 Double Recession:
Here we see that cyclical low from late 1976 on the left side of the chart, with gold once again discounting the cyclical peak in inflation with it peaking at the start of the 1980 recession, while inflation marched higher until the end of the economic contraction in summer 1980. Inflation rolled over but persisted at high levels as the economy limped into the second recession a year later, at which point gold and inflation proceeded to decline until the former began to discount the cyclical trough in inflation about a year prior to its arrival in summer 1983.
1990-1991 Recession (Gulf War I):
I included the 1987 crash period in this chart as an example of the importance of making a distinction between a growth rate cycle slowdown versus a recession relative to inflation. Gold remained relatively weak for much of the post-crash period despite year-over-year inflation persisting in an upward trend that culminated around the oil spike when Iraq invaded Kuwait, which also coincided with the beginning of the recession. We can see gold also responded to the geopolitical development, before ultimately relenting along with inflation as the recessionary period matured.
2001 Recession:
The period following the 1990-1991 recession was one of relative fiscal and monetary policy prudence, with Alan Greenspan pro-actively tightening monetary policy in 1994 using leading indicators on the inflation cycle. The tax reform bill in 1986, the deal cut by the first President Bush, and the deals cut by President Clinton with the “Republican wave” of 1994 in Congress, manifested in budget deficits falling, growth ramping, and inflation/gold both moderating. Gold did not respond to the cyclical upturn in inflation from 1998 into 2001, but inflation once again receded upon the arrival of the 2001 recession. Gold did begin to discount the cycle bottom, which also happened to coincide with what would become the secular trough in fiscal prudence following September 11, 2001.
2007-2009 Recession (GFC):
Following the trough in 2001-2002, both gold and inflation trended higher until the housing boom began to go bust in 2005. However, inflation was re-energized by the booming emerging markets and the burgeoning explosion in the price of oil, which culminated in July 2008. Once again, gold began to discount the cycle peak in inflation a bit in advance, and also the subsequent trough in the inflation cycle that coincided with the end of the recession.
With that walk down memory lane out of the way, what conclusions can we draw from these examples? I am asking you - remember I am the one who is a mess!
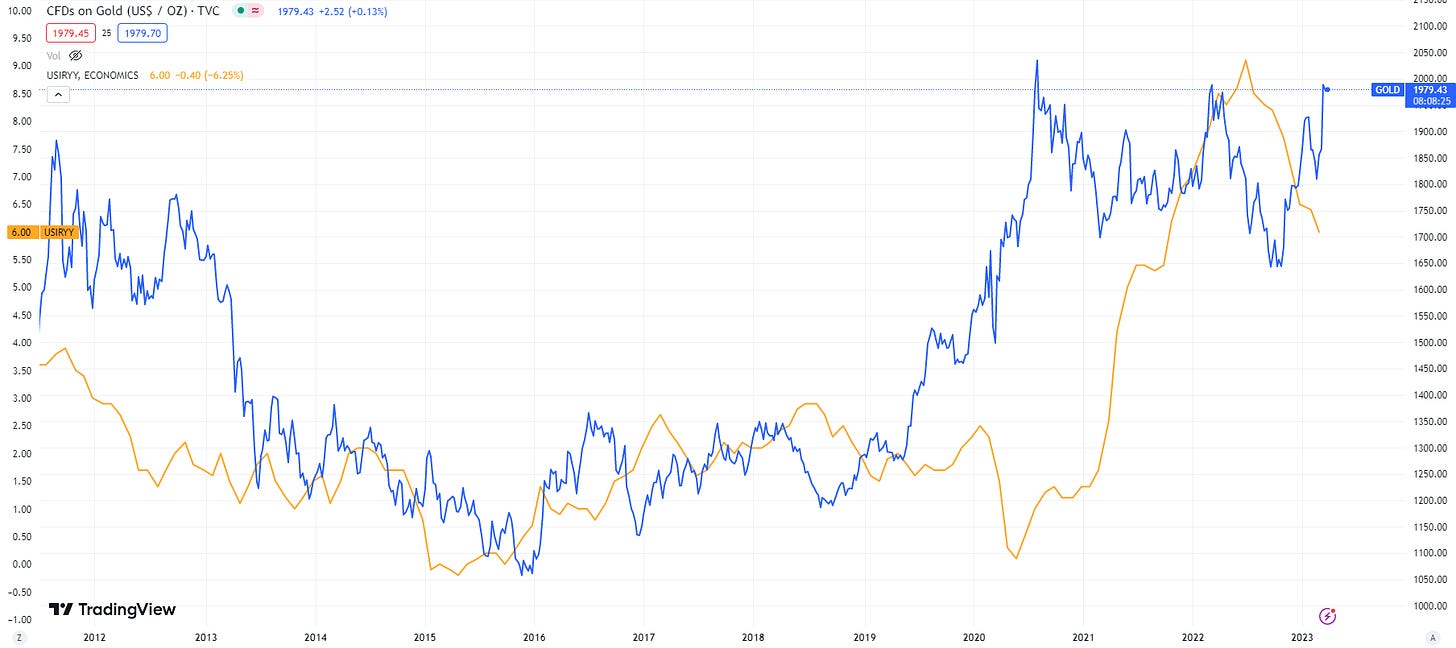
Here is recent history up until the present:
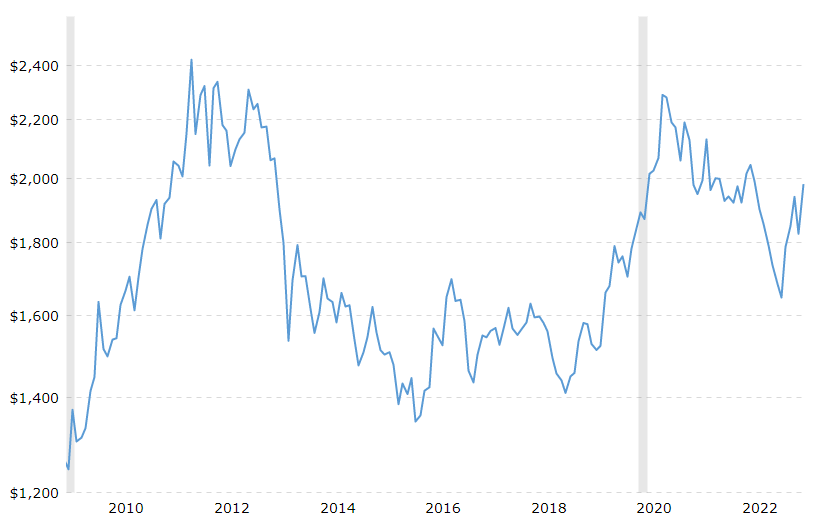
So far what we have seen is gold and inflation troughing around the period of larger fiscal deficits emerging in Trump’s term, and then the obvious explosion following the dual explosion in fiscal and monetary response during the pandemic period. Gold began to move well in advance of inflation, but actually peaked (particularly in inflation-adjusted terms) in August 2020.
Here is an adjusted chart:
The recent spate of anxiety and panic about the banking system triggered all sorts of recency bias and PTSD from the 2008 experience - yours truly included. The subsequent rally in gold has brought about some renewed interest, but sentiment and positioning remain low, which is in contrast with a period like early 2008.
The fiscal backdrop appears relatively neutral for now given the fast-approaching presidential year with a republican house pretending they are ‘fiscally prudent.’ The Fed and other central banks remain in tightening to neutral mode, and no - QE is not ‘money printing’ in the hyperinflationary or currency devaluation sense.
At this point, my best guess and hope are that the metals continue range bound and the miners retrace to make higher lows when/if a broad liquidation period in risk assets emerges as the recessionary bear market matures. Personally, I hold a lot more than I did by April 2008, but leaving a lot of dry powder to scale up exposure should such a scenario unfold. Alternatively, if gold can break out above the August 2020 peak in inflation-adjusted terms, it will likely be a trigger to consider scaling up.
While the cyclical backdrop relative to the inflation and business cycles have me anxious about the risks of at least one more test lower, the potential upside on a 3 to 5+ year time horizon leaves me willing to tolerate significant volatility for a partial, if still material, exposure. However, I recommend you ignore me on the topic.
Therapy session concluded - thank you for listening!






Great article, personally planning to lighten up on miners and gold a little soon, but only in the context of having firepower available.
Very good read Kayfabe. Thank you. In your opinion is gold anticipating another move higher in inflation? Looking at that second to last chart the divergence in inflation and gold is striking? Also, if gold gets thru that resistance line ( 3rd time is a charm) do you increase your allocation in the Dodo? Lastly, if there is a test down to 3600 and it doesn’t hold, would you expect gold to follow the S&P down as you mentioned early in the piece- like 2008? Thanks again!